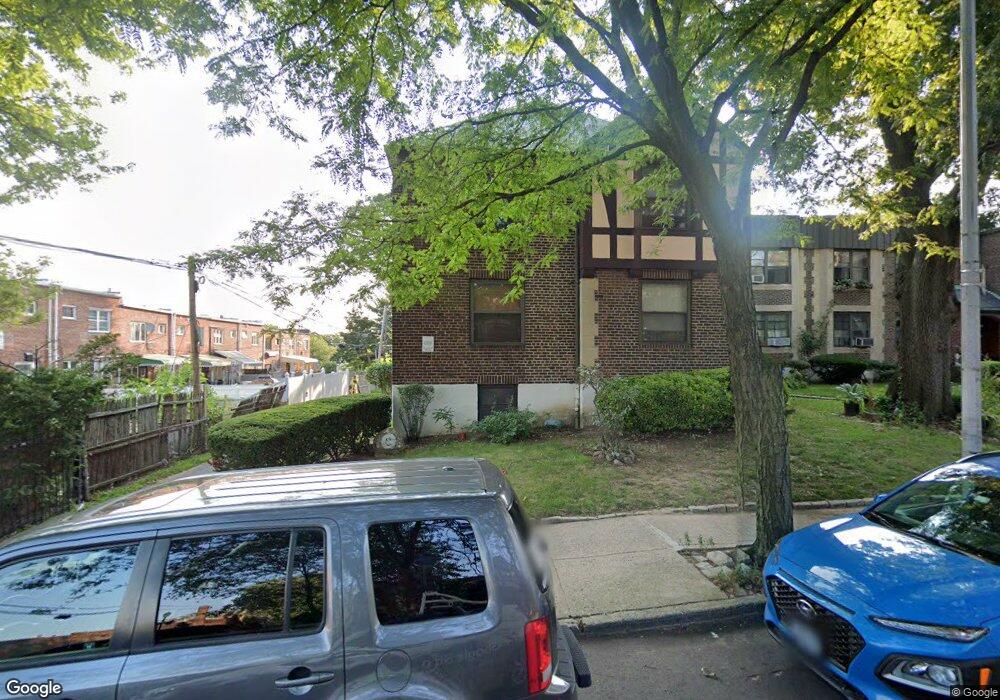
2111 78th St Unit 1 East Elmhurst, NY 11370
Ditmars Steinway NeighborhoodEstimated Value: $446,000 - $477,000
--
Bed
--
Bath
827
Sq Ft
$554/Sq Ft
Est. Value
About This Home
This home is located at 2111 78th St Unit 1, East Elmhurst, NY 11370 and is currently estimated at $457,823, approximately $553 per square foot. 2111 78th St Unit 1 is a home located in Queens County with nearby schools including P.S. 2 Alfred Zimberg, Is 141 The Steinway, and William Cullen Bryant High School.
Ownership History
Date
Name
Owned For
Owner Type
Purchase Details
Closed on
Jan 29, 2002
Sold by
Patrocinio Maria Helena and Patrocinio Moacyr Amanc
Bought by
Pepic Sehadeta
Current Estimated Value
Home Financials for this Owner
Home Financials are based on the most recent Mortgage that was taken out on this home.
Original Mortgage
$28,000
Outstanding Balance
$11,406
Interest Rate
6.85%
Estimated Equity
$446,417
Purchase Details
Closed on
Mar 31, 1998
Sold by
Buda Michael A and Buda Desiree Pereira
Bought by
Patrocinio Moacyr Amancio Do and Patrocinio Maria Helena
Home Financials for this Owner
Home Financials are based on the most recent Mortgage that was taken out on this home.
Original Mortgage
$68,600
Interest Rate
6.98%
Purchase Details
Closed on
Mar 31, 1995
Sold by
Cariello William J and Cariello Regina M
Bought by
Buda Michael A and Buda Desiree Pereira
Home Financials for this Owner
Home Financials are based on the most recent Mortgage that was taken out on this home.
Original Mortgage
$67,000
Interest Rate
8.33%
Mortgage Type
Seller Take Back
Create a Home Valuation Report for This Property
The Home Valuation Report is an in-depth analysis detailing your home's value as well as a comparison with similar homes in the area
Home Values in the Area
Average Home Value in this Area
Purchase History
| Date | Buyer | Sale Price | Title Company |
|---|---|---|---|
| Pepic Sehadeta | -- | -- | |
| Patrocinio Moacyr Amancio Do | -- | -- | |
| Buda Michael A | $68,000 | First American Title Ins Co |
Source: Public Records
Mortgage History
| Date | Status | Borrower | Loan Amount |
|---|---|---|---|
| Open | Pepic Sehadeta | $28,000 | |
| Previous Owner | Patrocinio Moacyr Amancio Do | $68,600 | |
| Previous Owner | Buda Michael A | $67,000 |
Source: Public Records
Tax History Compared to Growth
Tax History
| Year | Tax Paid | Tax Assessment Tax Assessment Total Assessment is a certain percentage of the fair market value that is determined by local assessors to be the total taxable value of land and additions on the property. | Land | Improvement |
|---|---|---|---|---|
| 2025 | $4,102 | $33,055 | $7,504 | $25,551 |
| 2024 | $2,950 | $32,813 | $7,504 | $25,309 |
| 2023 | $4,089 | $32,705 | $7,504 | $25,201 |
| 2022 | $2,861 | $32,920 | $7,504 | $25,416 |
| 2021 | $2,637 | $29,893 | $7,504 | $22,389 |
| 2020 | $2,847 | $34,237 | $7,504 | $26,733 |
| 2019 | $2,717 | $33,451 | $7,504 | $25,947 |
| 2018 | $3,593 | $28,249 | $7,504 | $20,745 |
| 2017 | $3,352 | $26,355 | $7,504 | $18,851 |
| 2016 | $3,183 | $26,355 | $7,504 | $18,851 |
| 2015 | $1,658 | $22,809 | $7,505 | $15,304 |
| 2014 | $1,658 | $21,306 | $7,504 | $13,802 |
Source: Public Records
Map
Nearby Homes
- 21-40 78th St Unit 2
- 21-16 77 Street 2nd Floor
- 76-12 Ditmars Blvd Unit B3
- 2209 76th St Unit C2
- 2220 78th St Unit A3
- 22-27 76 St Unit B2
- 2208 76th St Unit A3
- 22-28 77th St Unit C1
- 21-14 80th St
- 22-39 78 St
- 22-31 77th St Unit C2
- 19-65 79th St Unit 2C
- 21-43 80th St
- 2205 80th St
- 1950 80th St Unit 1
- 19-50 80th St Unit 1
- 2255 78th St Unit 2E
- 2134 74th St
- 2230 75th St
- 22-40 80th St Unit 2B
- 2111 78th St Unit 2
- 2113 78th St Unit 2
- 2113 78th St Unit 1
- 2115 78th St Unit 2
- 2115 78th St Unit 1
- 21-17 78th St
- 21-17 78th St Unit A2
- 2117 78th St Unit 2
- 2117 78th St Unit 1
- 7804 21st Ave
- 7806 21st Ave
- 7802 21st Ave
- 2121 78th St Unit 2
- 2121 78th St Unit 1
- 7808 21st Ave
- 2119 78th St Unit 2
- 2119 78th St Unit 1
- 2119 78th St Unit 2B
- 2119 78th St Unit 2B
- 2119 78th St Unit 1