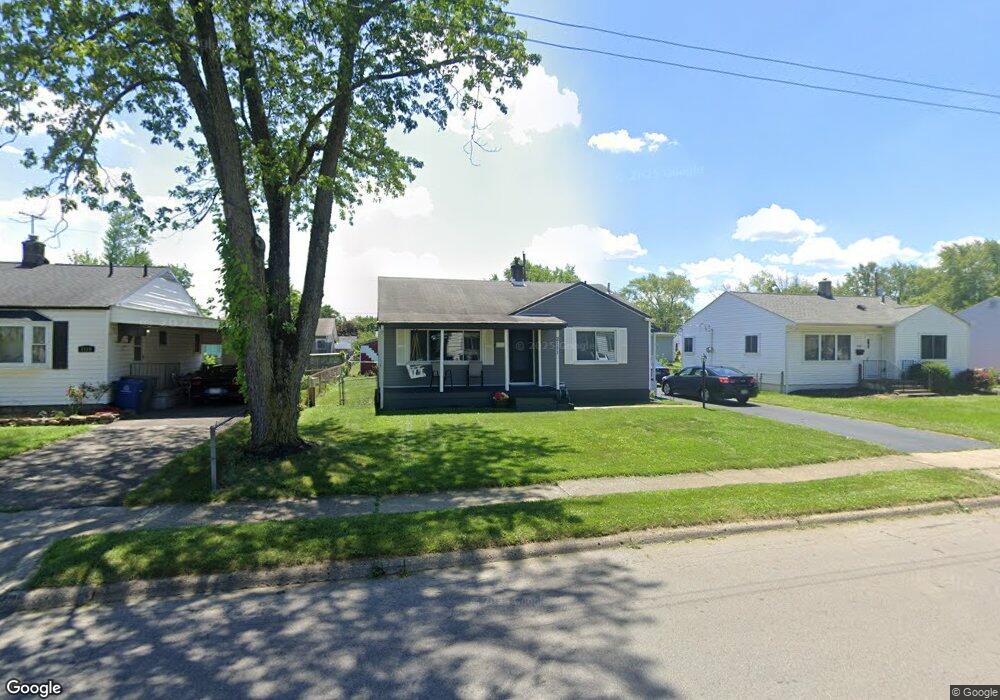
2111 Belcher Dr Columbus, OH 43224
North Linden NeighborhoodEstimated Value: $175,000 - $192,000
3
Beds
1
Bath
914
Sq Ft
$201/Sq Ft
Est. Value
About This Home
This home is located at 2111 Belcher Dr, Columbus, OH 43224 and is currently estimated at $183,762, approximately $201 per square foot. 2111 Belcher Dr is a home located in Franklin County with nearby schools including North Linden Elementary School, Medina Middle School, and Mifflin High School.
Ownership History
Date
Name
Owned For
Owner Type
Purchase Details
Closed on
May 18, 2004
Sold by
Caldwell James E
Bought by
Caldwell Mary A
Current Estimated Value
Home Financials for this Owner
Home Financials are based on the most recent Mortgage that was taken out on this home.
Original Mortgage
$87,500
Outstanding Balance
$42,205
Interest Rate
5.91%
Mortgage Type
New Conventional
Estimated Equity
$141,557
Purchase Details
Closed on
Jul 15, 1994
Sold by
Day Richard S
Bought by
Caldwell Mary A and Caldwell James E
Home Financials for this Owner
Home Financials are based on the most recent Mortgage that was taken out on this home.
Original Mortgage
$64,500
Interest Rate
8.6%
Mortgage Type
New Conventional
Purchase Details
Closed on
Dec 9, 1988
Purchase Details
Closed on
Nov 22, 1988
Create a Home Valuation Report for This Property
The Home Valuation Report is an in-depth analysis detailing your home's value as well as a comparison with similar homes in the area
Home Values in the Area
Average Home Value in this Area
Purchase History
| Date | Buyer | Sale Price | Title Company |
|---|---|---|---|
| Caldwell Mary A | -- | Supreme Title Agency Ltd | |
| Caldwell Mary A | $67,900 | -- | |
| -- | -- | -- | |
| -- | $51,000 | -- |
Source: Public Records
Mortgage History
| Date | Status | Borrower | Loan Amount |
|---|---|---|---|
| Open | Caldwell Mary A | $87,500 | |
| Closed | Caldwell Mary A | $64,500 |
Source: Public Records
Tax History Compared to Growth
Tax History
| Year | Tax Paid | Tax Assessment Tax Assessment Total Assessment is a certain percentage of the fair market value that is determined by local assessors to be the total taxable value of land and additions on the property. | Land | Improvement |
|---|---|---|---|---|
| 2024 | $2,292 | $51,070 | $12,250 | $38,820 |
| 2023 | $2,263 | $51,065 | $12,250 | $38,815 |
| 2022 | $1,338 | $25,800 | $5,500 | $20,300 |
| 2021 | $1,341 | $25,800 | $5,500 | $20,300 |
| 2020 | $1,342 | $25,800 | $5,500 | $20,300 |
| 2019 | $1,257 | $20,720 | $4,410 | $16,310 |
| 2018 | $1,260 | $20,720 | $4,410 | $16,310 |
| 2017 | $1,325 | $20,720 | $4,410 | $16,310 |
| 2016 | $1,394 | $21,040 | $4,100 | $16,940 |
| 2015 | $1,265 | $21,040 | $4,100 | $16,940 |
| 2014 | $1,268 | $21,040 | $4,100 | $16,940 |
| 2013 | $695 | $23,380 | $4,550 | $18,830 |
Source: Public Records
Map
Nearby Homes
- 2144 Colfax Ave
- 4309 Walford St
- 4217 Hickman Rd
- 2194 Ashley Dr
- 4111 Walford St
- 2023 Ferris Rd
- 1997 Ferris Rd
- 2283 Ward Rd
- 1863 Ward Rd
- 4090 Cleveland Ave
- 2220 Sale Rd
- 1936 Case Rd
- 2219 Sale Rd
- 4714 Ascot Dr
- 1734 Ferris Rd
- 2594 Adda Ave
- 1896 Ormond Ave
- 2244 Balmoral Rd
- 2625 Clybourne Rd
- 2529 Ferris Park Dr S
- 2119 Belcher Dr
- 2114 Eden Ave
- 2122 Eden Ave
- 2104 Eden Ave
- 2129 Belcher Dr
- 2095 Belcher Dr
- 2128 Eden Ave
- 2096 Eden Ave
- 2110 Belcher Dr
- 2118 Belcher Dr
- 2104 Belcher Dr
- 2137 Belcher Dr
- 2124 Belcher Dr
- 2087 Belcher Dr
- 2096 Belcher Dr
- 2138 Eden Ave
- 2130 Belcher Dr
- 2088 Eden Ave
- 2090 Belcher Dr
- 2145 Belcher Dr