Estimated Value: $229,292 - $238,000
--
Bed
2
Baths
1,590
Sq Ft
$146/Sq Ft
Est. Value
About This Home
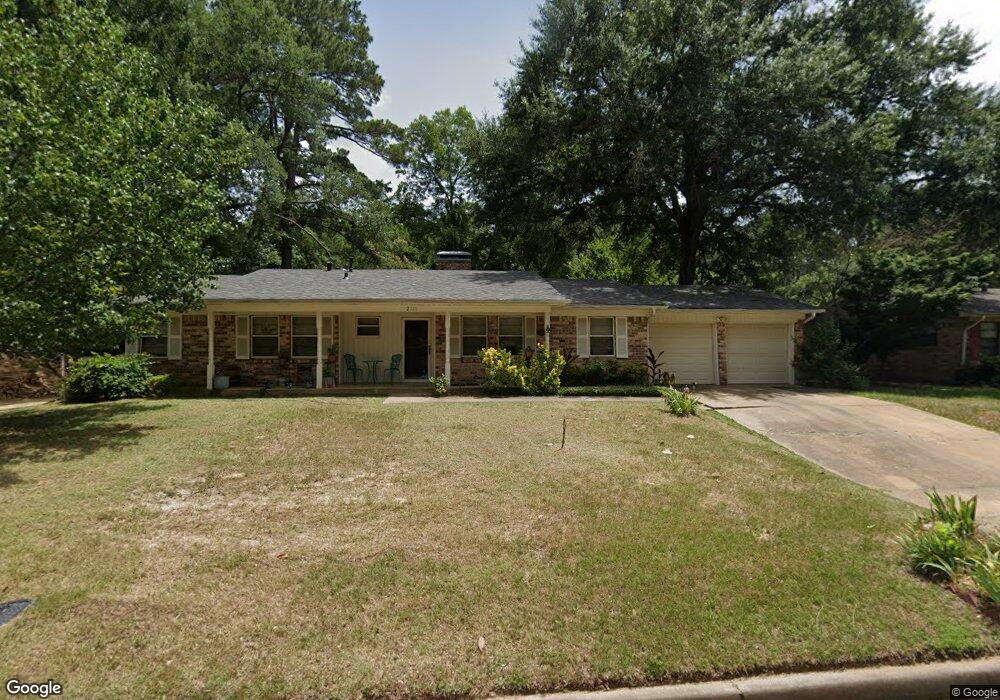
This home is located at 2111 Clubview Dr, Tyler, TX 75701 and is currently estimated at $232,323, approximately $146 per square foot. 2111 Clubview Dr is a home located in Smith County with nearby schools including Bell Elementary School, Hubbard Middle School, and Tyler Legacy High School.
Ownership History
Date
Name
Owned For
Owner Type
Purchase Details
Closed on
Mar 13, 2019
Sold by
Dickey Maria G
Bought by
Dickey Lisa Marie
Current Estimated Value
Home Financials for this Owner
Home Financials are based on the most recent Mortgage that was taken out on this home.
Original Mortgage
$87,865
Outstanding Balance
$76,773
Interest Rate
4.3%
Mortgage Type
Commercial
Estimated Equity
$155,550
Purchase Details
Closed on
Jun 25, 2018
Sold by
Dickey Adrienne Lee and Dickey Christin Louise
Bought by
Dickey Maria G
Purchase Details
Closed on
Sep 20, 2011
Sold by
Ethridge Carolyn Rose Sims and Petty Marilyn Sue Sims
Bought by
Dickey Bob L and Dickey Maria
Home Financials for this Owner
Home Financials are based on the most recent Mortgage that was taken out on this home.
Original Mortgage
$98,439
Interest Rate
4.4%
Mortgage Type
FHA
Create a Home Valuation Report for This Property
The Home Valuation Report is an in-depth analysis detailing your home's value as well as a comparison with similar homes in the area
Home Values in the Area
Average Home Value in this Area
Purchase History
| Date | Buyer | Sale Price | Title Company |
|---|---|---|---|
| Dickey Lisa Marie | -- | None Available | |
| Dickey Maria G | -- | None Available | |
| Dickey Bob L | -- | Ctc |
Source: Public Records
Mortgage History
| Date | Status | Borrower | Loan Amount |
|---|---|---|---|
| Open | Dickey Lisa Marie | $87,865 | |
| Closed | Dickey Bob L | $98,439 |
Source: Public Records
Tax History Compared to Growth
Tax History
| Year | Tax Paid | Tax Assessment Tax Assessment Total Assessment is a certain percentage of the fair market value that is determined by local assessors to be the total taxable value of land and additions on the property. | Land | Improvement |
|---|---|---|---|---|
| 2025 | $546 | $239,768 | $45,218 | $194,550 |
| 2024 | $546 | $181,631 | $25,859 | $197,556 |
| 2023 | $2,878 | $208,820 | $25,859 | $182,961 |
| 2022 | $2,941 | $167,748 | $25,859 | $141,889 |
| 2021 | $2,863 | $143,710 | $22,411 | $121,299 |
| 2020 | $2,655 | $135,756 | $22,411 | $113,345 |
| 2019 | $2,466 | $112,778 | $18,963 | $93,815 |
| 2018 | $2,304 | $105,951 | $17,239 | $88,712 |
| 2017 | $2,367 | $110,880 | $17,239 | $93,641 |
| 2016 | $2,288 | $107,182 | $17,239 | $89,943 |
| 2015 | $1,545 | $101,231 | $17,239 | $83,992 |
| 2014 | $1,545 | $98,384 | $17,239 | $81,145 |
Source: Public Records
Map
Nearby Homes
- 1929 Oakhurst Cir
- 2320 Sarasota Dr
- 2126 McDonald Rd
- 2010 McDonald Rd
- 2006 McDonald Rd
- 2331 Hunter St
- 1931 Sterling Dr
- 2408 Hunter St
- 2716 Royal Village Way
- 1715 Ridgeview Dr
- 2026 Neeley St
- The Dawson Plan at New Home Living at Medina
- 2949 Medina Dr
- The Hubbard Plan at New Home Living at Medina
- 2015 E 5th St
- 2002 E Faulkner St
- 2713 Brentwood Dr
- 2713 Tanglewood Dr
- 2509 Delmar Dr
- 1520 Clubview Dr
- 2105 2105 Clubview Dr
- 2119 Clubview Dr
- 2105 Clubview Dr
- 2121 Parkway Place
- 2121 2121 Parkway Place
- 2119 Parkway Place
- 2101 2101 Clubview Dr
- 2101 Clubview Dr
- 2106 Clubview Dr
- 2112 Clubview Dr
- 2100 Clubview Dr
- 2100 2100 Clubview Dr
- 2123 Parkway Place
- 2117 Parkway Place
- 2115 Waunell Dr
- 2021 2021 Clubview
- 2119 Waunell Dr
- 2125 Parkway Place
- 2020 Clubview Dr
- 2105 Waunell Dr