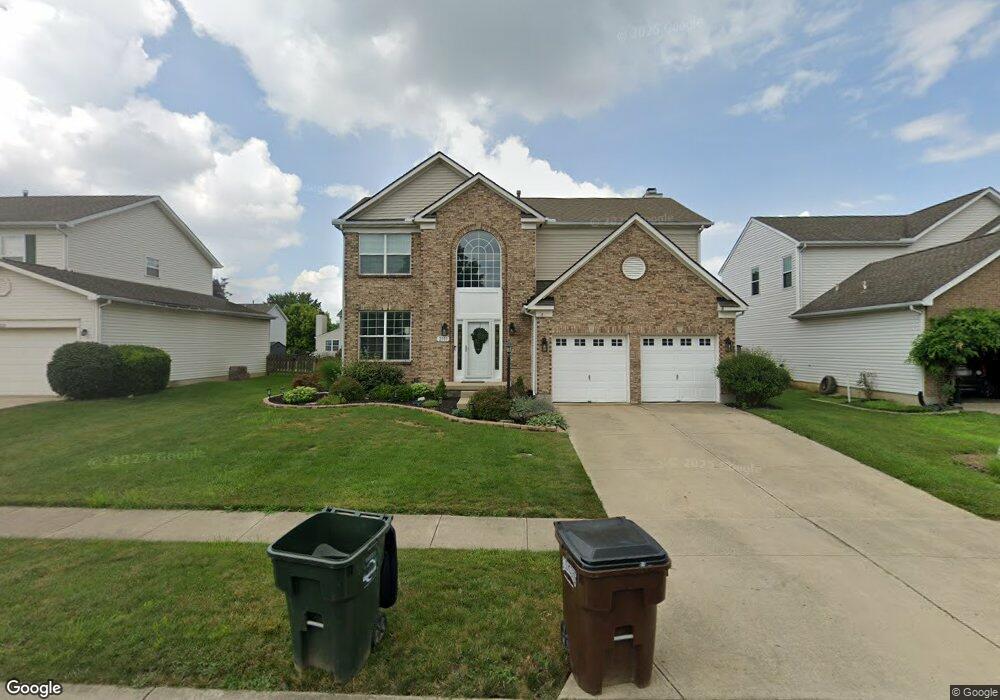
2111 Eastover Ln Miamisburg, OH 45342
Estimated Value: $349,000 - $380,000
4
Beds
3
Baths
2,822
Sq Ft
$130/Sq Ft
Est. Value
About This Home
This home is located at 2111 Eastover Ln, Miamisburg, OH 45342 and is currently estimated at $366,854, approximately $129 per square foot. 2111 Eastover Ln is a home located in Montgomery County with nearby schools including Miamisburg High School, The CinDay Academy, and Dayton Christian School.
Ownership History
Date
Name
Owned For
Owner Type
Purchase Details
Closed on
Jul 3, 2019
Sold by
Molnar Nathaniel K and Molnar Ariel A
Bought by
Almeida Felipe F De and Almeida Alathea G De
Current Estimated Value
Home Financials for this Owner
Home Financials are based on the most recent Mortgage that was taken out on this home.
Original Mortgage
$193,600
Outstanding Balance
$169,889
Interest Rate
3.9%
Mortgage Type
New Conventional
Estimated Equity
$196,965
Purchase Details
Closed on
Feb 19, 2016
Sold by
Wilson Mark Gregory and Wilson Marcia Ann
Bought by
Molnar Nathaniel K and Molnar Ariel A
Home Financials for this Owner
Home Financials are based on the most recent Mortgage that was taken out on this home.
Original Mortgage
$178,189
Interest Rate
3.62%
Mortgage Type
FHA
Purchase Details
Closed on
Feb 24, 1997
Sold by
Ryland Group Inc
Bought by
Wilson Mark Gregory and Wilson Marcia Ann
Purchase Details
Closed on
Jul 11, 1996
Sold by
Arnold Development Company
Bought by
Ryland Group Inc
Create a Home Valuation Report for This Property
The Home Valuation Report is an in-depth analysis detailing your home's value as well as a comparison with similar homes in the area
Home Values in the Area
Average Home Value in this Area
Purchase History
| Date | Buyer | Sale Price | Title Company |
|---|---|---|---|
| Almeida Felipe F De | $242,000 | Sterling Land Title Agcy Inc | |
| Molnar Nathaniel K | $181,500 | Home Services Title Llc | |
| Wilson Mark Gregory | $159,900 | Dayton Title Inc | |
| Ryland Group Inc | $23,500 | -- |
Source: Public Records
Mortgage History
| Date | Status | Borrower | Loan Amount |
|---|---|---|---|
| Open | Almeida Felipe F De | $193,600 | |
| Closed | Molnar Nathaniel K | $178,189 |
Source: Public Records
Tax History Compared to Growth
Tax History
| Year | Tax Paid | Tax Assessment Tax Assessment Total Assessment is a certain percentage of the fair market value that is determined by local assessors to be the total taxable value of land and additions on the property. | Land | Improvement |
|---|---|---|---|---|
| 2024 | $7,158 | $102,760 | $15,940 | $86,820 |
| 2023 | $7,158 | $102,760 | $15,940 | $86,820 |
| 2022 | $6,389 | $77,860 | $12,080 | $65,780 |
| 2021 | $6,028 | $77,860 | $12,080 | $65,780 |
| 2020 | $5,930 | $77,860 | $12,080 | $65,780 |
| 2019 | $5,157 | $61,340 | $10,500 | $50,840 |
| 2018 | $5,120 | $61,340 | $10,500 | $50,840 |
| 2017 | $5,090 | $61,340 | $10,500 | $50,840 |
| 2016 | $4,881 | $56,390 | $10,500 | $45,890 |
| 2015 | $4,798 | $56,390 | $10,500 | $45,890 |
| 2014 | $4,798 | $56,390 | $10,500 | $45,890 |
| 2012 | -- | $54,670 | $12,250 | $42,420 |
Source: Public Records
Map
Nearby Homes
- 9528 Summer Wind Trail
- 9747 Cobblewood Ct
- 9607 Olde Georgetown
- 2115 Autumn Haze Trail
- 10123 Heartwood Ct
- 1800 Olde Haley Dr
- 2540 Colinda Ct
- 10001 Forestedge Ln
- 9764 Olde Georgetown Way
- 9588 Tahoe Dr
- 9553 Tahoe Dr
- 9604 Tahoe Dr
- 1794 Placid Dr
- 9540 Tahoe Dr
- 9406 Tahoe Dr Unit 19406
- 9475 Copperton Dr
- 1565 Silverlake Dr
- 9519 Tahoe Dr
- 9515 Tahoe Dr
- 9251 Great Lakes Cir Unit 59251
- 2121 Eastover Ln
- 2101 Eastover Ln
- 9820 Lincolnshire Rd
- 2131 Eastover Ln
- 9810 Lincolnshire Rd
- 9830 Lincolnshire Rd
- 2110 Eastover Ln
- 9840 Lincolnshire Rd
- 2120 Eastover Ln
- 2100 Eastover Ln
- 2141 Eastover Ln
- 2264 Bradshire Rd
- 2272 Bradshire Rd
- 2130 Eastover Ln
- 2256 Bradshire Rd
- 9850 Lincolnshire Rd
- 2280 Bradshire Rd
- 2248 Bradshire Rd
- 2151 Eastover Ln
- 2140 Eastover Ln