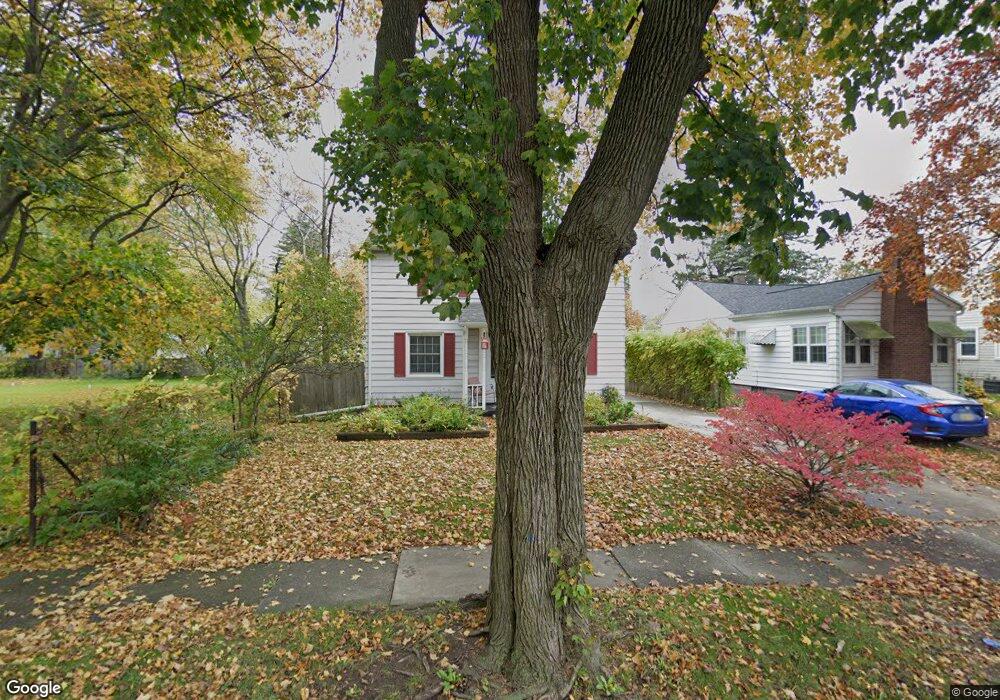
2111 Grant St Lansing, MI 48910
Clifford Park NeighborhoodEstimated Value: $160,000 - $189,000
3
Beds
2
Baths
1,485
Sq Ft
$121/Sq Ft
Est. Value
About This Home
This home is located at 2111 Grant St, Lansing, MI 48910 and is currently estimated at $179,606, approximately $120 per square foot. 2111 Grant St is a home located in Ingham County with nearby schools including Lyons Elementary School, Attwood School, and Eastern High School.
Ownership History
Date
Name
Owned For
Owner Type
Purchase Details
Closed on
Oct 5, 2016
Sold by
2111 Grant Llc
Bought by
Maurer Laura Jane and Thornsbury Tonnie
Current Estimated Value
Purchase Details
Closed on
Dec 6, 2011
Sold by
Maurer James and Maurer Cynthia
Bought by
2111 Grant Llc
Purchase Details
Closed on
Sep 30, 2011
Sold by
Michigan State University Federal Credit
Bought by
Maurer E James and Maurer Cynthia M
Purchase Details
Closed on
Jan 19, 2011
Sold by
Brassington Brenda J and Brassington Roland R
Bought by
Michigan State University Federal Credit
Purchase Details
Closed on
Jun 14, 2007
Sold by
Brassington Brenda J and Martin Brenda
Bought by
Brassington Brenda J and Brassington Roland R
Home Financials for this Owner
Home Financials are based on the most recent Mortgage that was taken out on this home.
Original Mortgage
$131,200
Interest Rate
6.2%
Mortgage Type
Stand Alone Refi Refinance Of Original Loan
Purchase Details
Closed on
Jan 14, 1997
Sold by
Clipper Thomas O and Clipper Anne E
Bought by
Martin Brenda
Create a Home Valuation Report for This Property
The Home Valuation Report is an in-depth analysis detailing your home's value as well as a comparison with similar homes in the area
Home Values in the Area
Average Home Value in this Area
Purchase History
| Date | Buyer | Sale Price | Title Company |
|---|---|---|---|
| Maurer Laura Jane | $65,000 | Chicago Title | |
| 2111 Grant Llc | -- | None Available | |
| Maurer E James | $37,000 | Tri County Title Agency Llc | |
| Michigan State University Federal Credit | -- | None Available | |
| Brassington Brenda J | -- | Stewart Title | |
| Martin Brenda | $85,000 | -- |
Source: Public Records
Mortgage History
| Date | Status | Borrower | Loan Amount |
|---|---|---|---|
| Previous Owner | Brassington Brenda J | $131,200 |
Source: Public Records
Tax History Compared to Growth
Tax History
| Year | Tax Paid | Tax Assessment Tax Assessment Total Assessment is a certain percentage of the fair market value that is determined by local assessors to be the total taxable value of land and additions on the property. | Land | Improvement |
|---|---|---|---|---|
| 2025 | $3,283 | $82,900 | $7,400 | $75,500 |
| 2024 | $26 | $74,700 | $7,400 | $67,300 |
| 2023 | $3,078 | $65,600 | $7,400 | $58,200 |
| 2022 | $2,774 | $58,000 | $6,800 | $51,200 |
| 2021 | $2,716 | $54,600 | $4,600 | $50,000 |
| 2020 | $2,700 | $52,400 | $4,600 | $47,800 |
| 2019 | $2,588 | $45,400 | $4,600 | $40,800 |
| 2018 | $2,425 | $40,600 | $4,600 | $36,000 |
| 2017 | $2,322 | $40,600 | $4,600 | $36,000 |
| 2016 | $2,864 | $39,900 | $4,600 | $35,300 |
| 2015 | $2,864 | $38,000 | $9,122 | $28,878 |
| 2014 | $2,864 | $38,500 | $7,150 | $31,350 |
Source: Public Records
Map
Nearby Homes
- 704 Mckim Ave
- 619 E Mount Hope Ave
- 2208 Lyons Ave
- 535 Riley St
- 512 Woodrow Ave
- 525 E Mount Hope Ave
- 1818 Ray St
- 1703 Linval St
- 616 Isbell St
- 626 Tisdale Ave
- 2345 Lyons Ave
- 707 Isbell St
- 1731 Herbert St
- 2201 S Pennsylvania Ave
- 915 Tisdale Ave
- 2309 S Pennsylvania Ave
- 2340 S Pennsylvania Ave
- 2302 Maplewood Ave
- 1807 Teel Ave
- 531 Torrence Ct