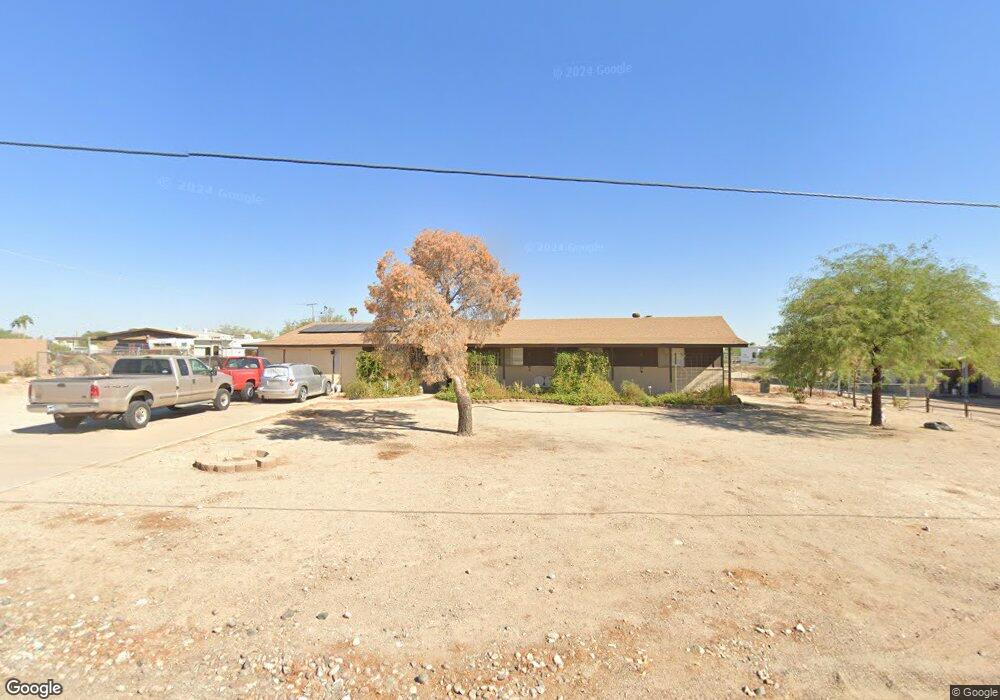
2111 N 202nd Ave Buckeye, AZ 85396
Estimated Value: $415,026 - $468,000
--
Bed
2
Baths
1,716
Sq Ft
$257/Sq Ft
Est. Value
About This Home
This home is located at 2111 N 202nd Ave, Buckeye, AZ 85396 and is currently estimated at $441,257, approximately $257 per square foot. 2111 N 202nd Ave is a home located in Maricopa County with nearby schools including Scott L. Libby Elementary School, Verrado Middle School, and Verrado High School.
Ownership History
Date
Name
Owned For
Owner Type
Purchase Details
Closed on
Sep 18, 2001
Sold by
Jordan Kim W
Bought by
Jordan Kim W and Jordan Cindy C
Current Estimated Value
Home Financials for this Owner
Home Financials are based on the most recent Mortgage that was taken out on this home.
Original Mortgage
$28,000
Outstanding Balance
$10,796
Interest Rate
6.99%
Estimated Equity
$430,461
Purchase Details
Closed on
Aug 24, 2001
Sold by
Jordan Cindy C
Bought by
Jordan Kim W
Home Financials for this Owner
Home Financials are based on the most recent Mortgage that was taken out on this home.
Original Mortgage
$28,000
Outstanding Balance
$10,796
Interest Rate
6.99%
Estimated Equity
$430,461
Purchase Details
Closed on
Nov 17, 1994
Sold by
Atkins Darold H and Atkins Judith A
Bought by
Jordan Kim W and Jordan Cindy C
Home Financials for this Owner
Home Financials are based on the most recent Mortgage that was taken out on this home.
Original Mortgage
$93,100
Interest Rate
9.1%
Mortgage Type
New Conventional
Create a Home Valuation Report for This Property
The Home Valuation Report is an in-depth analysis detailing your home's value as well as a comparison with similar homes in the area
Home Values in the Area
Average Home Value in this Area
Purchase History
| Date | Buyer | Sale Price | Title Company |
|---|---|---|---|
| Jordan Kim W | -- | Fidelity Title | |
| Jordan Kim W | -- | Fidelity National Title | |
| Jordan Kim W | $98,000 | Security Title Agency |
Source: Public Records
Mortgage History
| Date | Status | Borrower | Loan Amount |
|---|---|---|---|
| Open | Jordan Kim W | $28,000 | |
| Closed | Jordan Kim W | $93,100 |
Source: Public Records
Tax History Compared to Growth
Tax History
| Year | Tax Paid | Tax Assessment Tax Assessment Total Assessment is a certain percentage of the fair market value that is determined by local assessors to be the total taxable value of land and additions on the property. | Land | Improvement |
|---|---|---|---|---|
| 2025 | $1,500 | $12,901 | -- | -- |
| 2024 | $1,433 | $12,286 | -- | -- |
| 2023 | $1,433 | $36,400 | $7,280 | $29,120 |
| 2022 | $1,364 | $24,780 | $4,950 | $19,830 |
| 2021 | $1,400 | $23,860 | $4,770 | $19,090 |
| 2020 | $1,361 | $23,210 | $4,640 | $18,570 |
| 2019 | $1,404 | $21,320 | $4,260 | $17,060 |
| 2018 | $1,239 | $15,930 | $3,180 | $12,750 |
| 2017 | $1,172 | $13,650 | $2,730 | $10,920 |
| 2016 | $1,113 | $12,200 | $2,440 | $9,760 |
| 2015 | $1,043 | $7,920 | $1,580 | $6,340 |
Source: Public Records
Map
Nearby Homes
- 000 N 201st Ave Unit 11
- 2423 N Beverly Place
- 20499 W Alsap Rd
- 2365 N Springfield St
- 20552 W Carlton Manor
- 20460 W Legend Trail
- 19950 W Cambridge Ave
- 20629 W Legend Trail
- 20697 W Delaney Dr
- 20556 W Point Ridge Rd
- 20709 W Delaney Dr
- 20171 W Cheery Lynn Rd
- 2727 N Acacia Way
- 20269 W Catalina Dr
- 199XX W Edgemont Ave Unit 4
- 198XXX W Edgemont Ave Unit 4
- 20258 W Catalina Dr
- 20270 W Catalina Dr
- 20728 W Legend Trail
- 197XXX W Edgemont Ave Unit 4
- 2123 N 202nd Ave
- 2123 N 202nd Ave Unit 184
- 2101 N 202nd Ave
- 2110 N 202nd Ave
- 2018 N 202nd Ave
- 2201 N 202nd Ave
- 2023 N 202nd Ave
- 2102 N 202nd Ave
- 2118 N 202nd Ave
- 2004 N 202nd Ave
- 2211 N 202nd Ave
- 2211 N 202nd Ave
- 2011 N 202nd Ave
- 2112 N 201st Ave
- 2102 N 201st Ave
- 2124 N 201st Ave
- 1916 N 202nd Ave
- 2206 N 202nd Ave
- 2024 N 201st Ave
- 2202 N 201st Ave