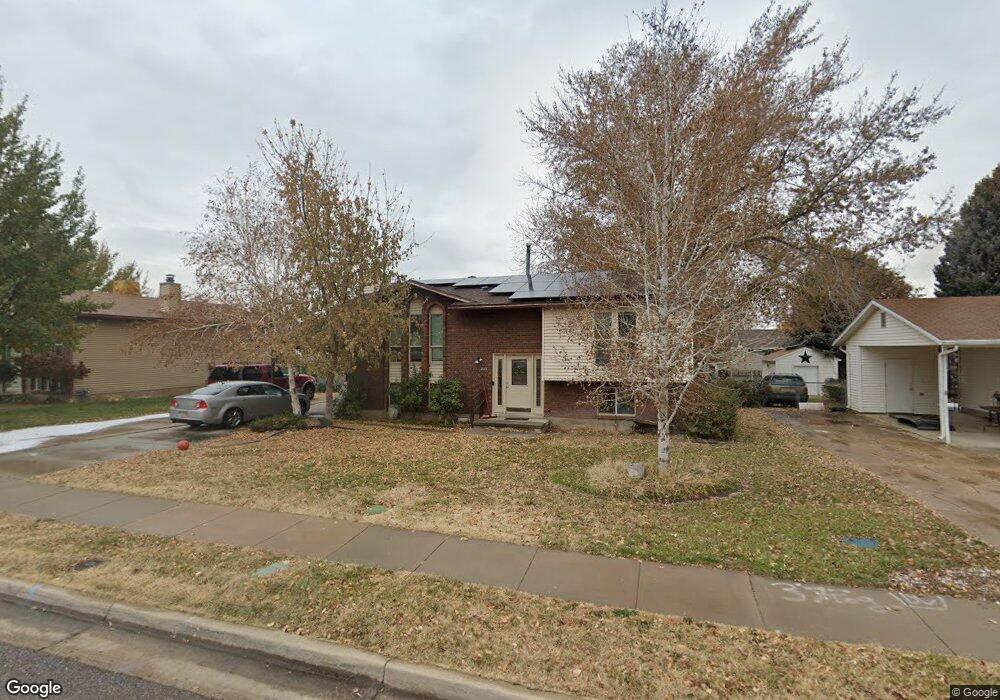
2111 N 900 W Clearfield, UT 84015
Estimated Value: $413,000 - $432,000
4
Beds
2
Baths
2,128
Sq Ft
$198/Sq Ft
Est. Value
About This Home
This home is located at 2111 N 900 W, Clearfield, UT 84015 and is currently estimated at $421,656, approximately $198 per square foot. 2111 N 900 W is a home located in Davis County with nearby schools including Fremont School, Sunset Junior High School, and Northridge High School.
Ownership History
Date
Name
Owned For
Owner Type
Purchase Details
Closed on
Oct 31, 2022
Sold by
Hancock Travis
Bought by
Blamires Lindsay and Blamires Derek
Current Estimated Value
Home Financials for this Owner
Home Financials are based on the most recent Mortgage that was taken out on this home.
Original Mortgage
$340,252
Outstanding Balance
$328,852
Interest Rate
6.7%
Mortgage Type
FHA
Estimated Equity
$92,804
Purchase Details
Closed on
Aug 24, 2021
Sold by
Hancock Travis
Bought by
Hancock Travis and Hancock Janelle
Purchase Details
Closed on
Jun 17, 2009
Sold by
The Secretary Of Housing & Urban Develop
Bought by
Hancock Janelle and Hancock Travis
Home Financials for this Owner
Home Financials are based on the most recent Mortgage that was taken out on this home.
Original Mortgage
$115,900
Interest Rate
4.82%
Mortgage Type
Purchase Money Mortgage
Purchase Details
Closed on
Jun 13, 2008
Sold by
Everhome Mortgage Co
Bought by
Hud
Purchase Details
Closed on
Jan 8, 2008
Sold by
Kariya Marilyn K
Bought by
Everhome Mortgage Co
Purchase Details
Closed on
Oct 21, 2005
Sold by
Cunningham Trace T and Cunningham Wendy P
Bought by
Kariya Marilyn K
Home Financials for this Owner
Home Financials are based on the most recent Mortgage that was taken out on this home.
Original Mortgage
$121,800
Interest Rate
5.67%
Mortgage Type
FHA
Purchase Details
Closed on
Oct 19, 2005
Sold by
Kariya Marilyn K
Bought by
Kariya Marilyn K and Stuckman Carol
Home Financials for this Owner
Home Financials are based on the most recent Mortgage that was taken out on this home.
Original Mortgage
$121,800
Interest Rate
5.67%
Mortgage Type
FHA
Create a Home Valuation Report for This Property
The Home Valuation Report is an in-depth analysis detailing your home's value as well as a comparison with similar homes in the area
Home Values in the Area
Average Home Value in this Area
Purchase History
| Date | Buyer | Sale Price | Title Company |
|---|---|---|---|
| Blamires Lindsay | -- | Us Title | |
| Hancock Travis | -- | Mountain View Title & Escrow | |
| Hancock Travis | -- | Mountain View Title & Escrow | |
| Hancock Janelle | -- | Monument Title Ins Inc | |
| Hud | -- | Inwest Title Services Inc | |
| Everhome Mortgage Co | $138,614 | First Southwestern Title | |
| Kariya Marilyn K | -- | Equity Title Ins Agency Inc | |
| Kariya Marilyn K | -- | Bonneville Title Company |
Source: Public Records
Mortgage History
| Date | Status | Borrower | Loan Amount |
|---|---|---|---|
| Open | Blamires Lindsay | $340,252 | |
| Previous Owner | Hancock Janelle | $115,900 | |
| Previous Owner | Kariya Marilyn K | $121,800 |
Source: Public Records
Tax History Compared to Growth
Tax History
| Year | Tax Paid | Tax Assessment Tax Assessment Total Assessment is a certain percentage of the fair market value that is determined by local assessors to be the total taxable value of land and additions on the property. | Land | Improvement |
|---|---|---|---|---|
| 2025 | $2,105 | $210,100 | $92,179 | $117,921 |
| 2024 | $2,105 | $203,500 | $101,135 | $102,365 |
| 2023 | $1,946 | $348,000 | $115,398 | $232,602 |
| 2022 | $2,051 | $202,950 | $70,185 | $132,765 |
| 2021 | $1,881 | $276,000 | $88,547 | $187,453 |
| 2020 | $1,632 | $237,000 | $75,603 | $161,397 |
| 2019 | $1,550 | $220,000 | $87,675 | $132,325 |
| 2018 | $1,435 | $200,000 | $73,966 | $126,034 |
| 2016 | $1,204 | $86,680 | $28,879 | $57,801 |
| 2015 | $1,148 | $78,595 | $28,879 | $49,716 |
| 2014 | $1,197 | $83,220 | $28,879 | $54,341 |
| 2013 | -- | $66,550 | $25,230 | $41,320 |
Source: Public Records
Map
Nearby Homes