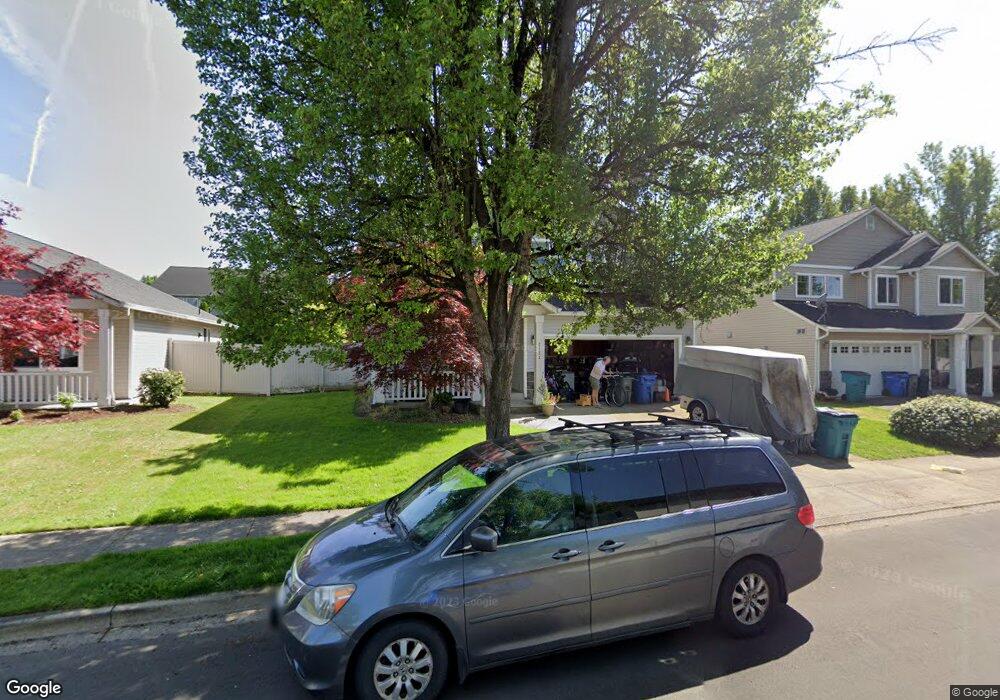
2111 NW 10th Way Battle Ground, WA 98604
Estimated Value: $495,622 - $543,000
4
Beds
3
Baths
1,979
Sq Ft
$262/Sq Ft
Est. Value
About This Home
This home is located at 2111 NW 10th Way, Battle Ground, WA 98604 and is currently estimated at $517,906, approximately $261 per square foot. 2111 NW 10th Way is a home located in Clark County with nearby schools including Daybreak Primary School, Daybreak Middle School, and Battle Ground High School.
Ownership History
Date
Name
Owned For
Owner Type
Purchase Details
Closed on
Nov 15, 2012
Sold by
Horn Thomas D and Horn Jamie K
Bought by
Weeks Robert and Weeks Susan
Current Estimated Value
Purchase Details
Closed on
Nov 9, 2005
Sold by
Nam Soo K
Bought by
Horn Thomas D and Horn Jamie K
Home Financials for this Owner
Home Financials are based on the most recent Mortgage that was taken out on this home.
Original Mortgage
$26,850
Interest Rate
5.93%
Mortgage Type
Credit Line Revolving
Purchase Details
Closed on
Jan 20, 2003
Sold by
Rockford Homes Inc
Bought by
Nam Soo K
Home Financials for this Owner
Home Financials are based on the most recent Mortgage that was taken out on this home.
Original Mortgage
$138,450
Interest Rate
5.96%
Create a Home Valuation Report for This Property
The Home Valuation Report is an in-depth analysis detailing your home's value as well as a comparison with similar homes in the area
Home Values in the Area
Average Home Value in this Area
Purchase History
| Date | Buyer | Sale Price | Title Company |
|---|---|---|---|
| Weeks Robert | $185,000 | Fidelity National Title | |
| Horn Thomas D | $268,500 | Stewart Title | |
| Nam Soo K | -- | First American Title |
Source: Public Records
Mortgage History
| Date | Status | Borrower | Loan Amount |
|---|---|---|---|
| Previous Owner | Horn Thomas D | $26,850 | |
| Previous Owner | Horn Thomas D | $214,800 | |
| Previous Owner | Nam Soo K | $138,450 |
Source: Public Records
Tax History Compared to Growth
Tax History
| Year | Tax Paid | Tax Assessment Tax Assessment Total Assessment is a certain percentage of the fair market value that is determined by local assessors to be the total taxable value of land and additions on the property. | Land | Improvement |
|---|---|---|---|---|
| 2025 | $3,515 | $426,296 | $130,000 | $296,296 |
| 2024 | $3,148 | $430,938 | $130,000 | $300,938 |
| 2023 | $3,360 | $439,124 | $130,000 | $309,124 |
| 2022 | $3,298 | $427,377 | $108,750 | $318,627 |
| 2021 | $3,244 | $364,529 | $93,750 | $270,779 |
| 2020 | $2,707 | $328,876 | $86,250 | $242,626 |
| 2019 | $2,247 | $310,990 | $88,500 | $222,490 |
| 2018 | $2,733 | $302,067 | $0 | $0 |
| 2017 | $2,330 | $269,877 | $0 | $0 |
| 2016 | $2,268 | $250,579 | $0 | $0 |
| 2015 | $2,262 | $223,815 | $0 | $0 |
| 2014 | -- | $211,863 | $0 | $0 |
| 2013 | -- | $190,728 | $0 | $0 |
Source: Public Records
Map
Nearby Homes
- 2112 NW 10th St
- 2013 NW 13th St
- 1114 NW 19th Ave
- 802 NW 20th Ave
- 2401 NW 10th Way
- 1210 NW 24th Ave
- 810 NW 25th Ave
- 1812 NW 14th St
- 2200 NW 5th St
- 1523 NW 25th Ave
- 1607 NW 17th Place
- 1112 NW 14th Ct
- 1859 NW 18th St
- 1810 NW 18th St
- 1808 NW 18th St
- 1804 NW 18th St
- 1806 NW 18th St
- 2812 NW 14th St
- 1730 NW 18th St
- 1722 NW 18th St
- 2115 NW 10th Way
- 2107 NW 10th Way
- 2116 NW 10th St
- 2101 NW 10th Way
- 2108 NW 10th St
- 0 NW 10th Way
- 2201 NW 10th Way
- 1020 NW 21st Ave
- 2104 NW 10th St
- 2202 NW 10th St
- 1025 NW 22nd Ave
- 2207 NW 10th Way
- 1026 NW 21st Ave
- 2015 NW 10th Way
- 1020 NW 22nd Ave
- 2208 NW 10th St
- 913 NW 22nd Ave
- 912 NW 21st Ave
- 2211 NW 10th Way
- 1024 NW 22nd Ave