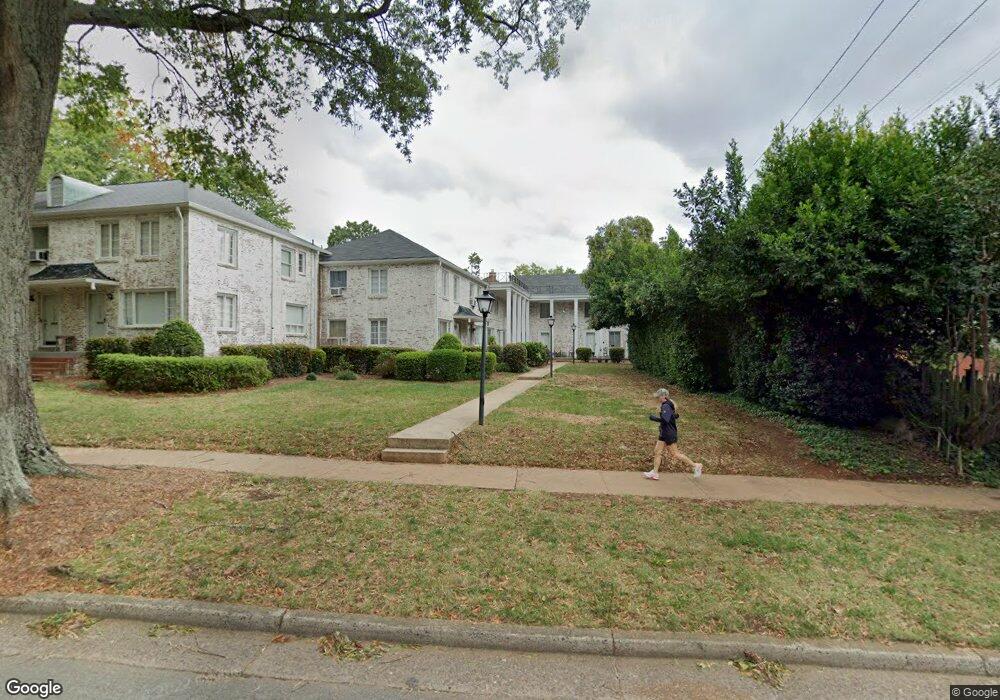
2111 Queens Rd W Unit L Charlotte, NC 28207
Myers Park NeighborhoodEstimated Value: $306,000 - $502,000
2
Beds
1
Bath
986
Sq Ft
$402/Sq Ft
Est. Value
About This Home
This home is located at 2111 Queens Rd W Unit L, Charlotte, NC 28207 and is currently estimated at $396,512, approximately $402 per square foot. 2111 Queens Rd W Unit L is a home located in Mecklenburg County with nearby schools including Sedgefield Elementary, Dilworth Elementary School: Latta Campus, and Sedgefield Middle School.
Ownership History
Date
Name
Owned For
Owner Type
Purchase Details
Closed on
May 26, 2022
Sold by
Stroup Tcherkezian Bonnie and Stroup Matthew A
Bought by
Tcherkezian Bonnie Stroup and Tcherkezian Matthew A
Current Estimated Value
Purchase Details
Closed on
Jun 28, 2013
Sold by
Jablokov Victor R and Shafiro Margarita V
Bought by
Stroup Bonnie E
Home Financials for this Owner
Home Financials are based on the most recent Mortgage that was taken out on this home.
Original Mortgage
$133,600
Interest Rate
3.53%
Mortgage Type
New Conventional
Purchase Details
Closed on
May 24, 2004
Sold by
Subbarao Suresh N
Bought by
Jablokov Victor R and Shafiro Margarita
Home Financials for this Owner
Home Financials are based on the most recent Mortgage that was taken out on this home.
Original Mortgage
$116,800
Interest Rate
4.87%
Mortgage Type
Purchase Money Mortgage
Create a Home Valuation Report for This Property
The Home Valuation Report is an in-depth analysis detailing your home's value as well as a comparison with similar homes in the area
Home Values in the Area
Average Home Value in this Area
Purchase History
| Date | Buyer | Sale Price | Title Company |
|---|---|---|---|
| Tcherkezian Bonnie Stroup | -- | Doyle & Wallace Pllc | |
| Stroup Bonnie E | $167,000 | None Available | |
| Jablokov Victor R | $146,000 | Old Republic National Title |
Source: Public Records
Mortgage History
| Date | Status | Borrower | Loan Amount |
|---|---|---|---|
| Previous Owner | Stroup Bonnie E | $133,600 | |
| Previous Owner | Jablokov Victor R | $116,800 | |
| Closed | Jablokov Victor R | $116,800 |
Source: Public Records
Tax History Compared to Growth
Tax History
| Year | Tax Paid | Tax Assessment Tax Assessment Total Assessment is a certain percentage of the fair market value that is determined by local assessors to be the total taxable value of land and additions on the property. | Land | Improvement |
|---|---|---|---|---|
| 2025 | $2,456 | $304,116 | -- | $304,116 |
| 2024 | $2,456 | $304,116 | -- | $304,116 |
| 2023 | $2,370 | $304,116 | $0 | $304,116 |
| 2022 | $2,167 | $211,500 | $0 | $211,500 |
| 2021 | $2,155 | $211,500 | $0 | $211,500 |
| 2020 | $2,148 | $211,500 | $0 | $211,500 |
| 2019 | $2,133 | $211,500 | $0 | $211,500 |
| 2018 | $1,982 | $145,500 | $62,500 | $83,000 |
| 2017 | $1,946 | $145,500 | $62,500 | $83,000 |
| 2016 | $1,937 | $145,500 | $62,500 | $83,000 |
| 2015 | $1,925 | $145,500 | $62,500 | $83,000 |
| 2014 | $1,908 | $145,500 | $62,500 | $83,000 |
Source: Public Records
Map
Nearby Homes
- 2251 Selwyn Ave Unit 201
- 2220 Roswell Ave Unit F
- 2624 Chilton Place
- 1869 Queens Rd W
- 1960 Maryland Ave
- 2503 Roswell Ave Unit 208
- 2043 Lynnwood Dr
- 1844 Maryland Ave
- 1817 Jameston Dr
- 1786 Sterling Rd
- 2113 Brandon Cir
- 2714 Selwyn Ave
- 1728 Jameston Dr
- 108 Tranquil Ave
- 2715 Selwyn Ave Unit 35
- 2715 Selwyn Ave Unit 31
- 1665 Sterling Rd
- 2719 Selwyn Ave Unit 4
- 2909 Hanson Dr
- 2149 Colony Rd
- 2113 Queens Rd W Unit M
- 2119 Queens Rd W Unit P
- 2107 Queens Rd W Unit J
- 2115 Queens Rd W Unit N
- 2337 Selwyn Ave
- 2341 Selwyn Ave Unit C
- 2109 Queens Rd W Unit K
- 2101 Queens Rd W Unit G
- 2347 Selwyn Ave Unit F
- 2105 Queens Rd W Unit I
- 2117 Queens Rd W Unit O
- 2103 Queens Rd W Unit H
- 2343 Selwyn Ave Unit D
- 2345 Selwyn Ave Unit E
- 2339 Selwyn Ave Unit B
- 2339 Selwyn Ave Unit 2239
- 2327 Selwyn Ave
- 2327 Selwyn Ave Unit E
- 2329 Selwyn Ave
- 2329 Selwyn Ave Unit F