Estimated Value: $387,000 - $488,000
5
Beds
2
Baths
2,835
Sq Ft
$159/Sq Ft
Est. Value
About This Home
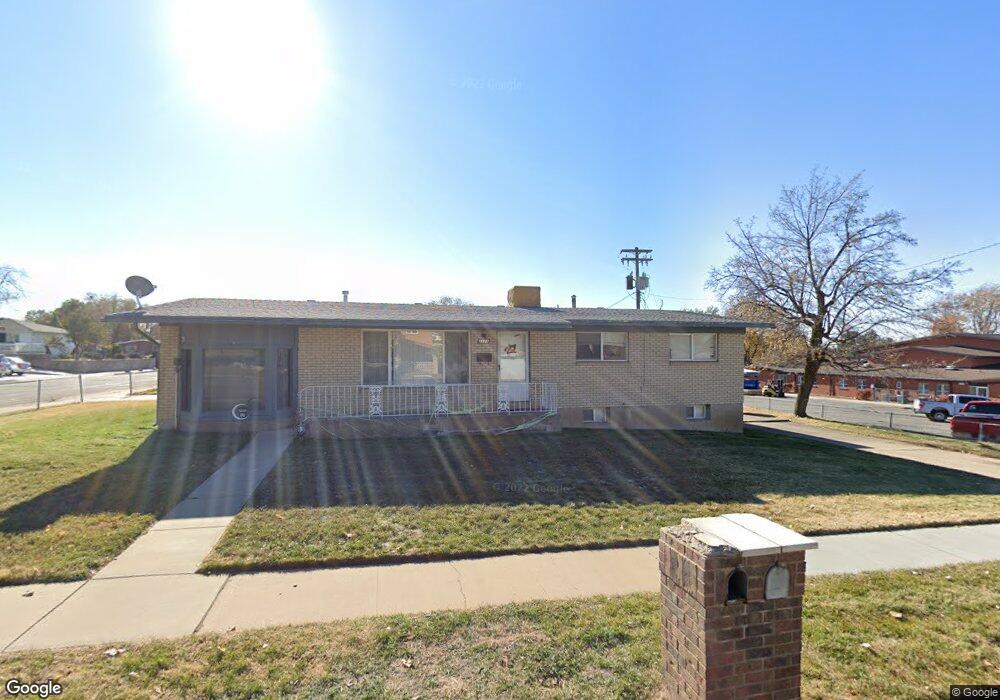
This home is located at 2111 W 5900 S, Roy, UT 84067 and is currently estimated at $451,146, approximately $159 per square foot. 2111 W 5900 S is a home located in Weber County with nearby schools including Municipal School, Roy Junior High School, and Roy High School.
Ownership History
Date
Name
Owned For
Owner Type
Purchase Details
Closed on
Apr 4, 2018
Sold by
Brown Dennis and Brown Clair L
Bought by
Brown Dennis Lyn and Brown Clair Lynn
Current Estimated Value
Purchase Details
Closed on
Nov 3, 2003
Sold by
Larson Mark E and Larson Jeannie
Bought by
Brown Dennis L and Brown Clair L
Purchase Details
Closed on
Feb 19, 1997
Sold by
Dabb Darrell H and Dabb Cindy
Bought by
Larson Mark E and Larson Jeannie
Home Financials for this Owner
Home Financials are based on the most recent Mortgage that was taken out on this home.
Original Mortgage
$106,340
Interest Rate
7.85%
Mortgage Type
FHA
Create a Home Valuation Report for This Property
The Home Valuation Report is an in-depth analysis detailing your home's value as well as a comparison with similar homes in the area
Home Values in the Area
Average Home Value in this Area
Purchase History
| Date | Buyer | Sale Price | Title Company |
|---|---|---|---|
| Brown Dennis Lyn | -- | None Available | |
| Brown Dennis L | -- | First American Title | |
| Larson Mark E | -- | U S Title |
Source: Public Records
Mortgage History
| Date | Status | Borrower | Loan Amount |
|---|---|---|---|
| Previous Owner | Larson Mark E | $106,340 |
Source: Public Records
Tax History
| Year | Tax Paid | Tax Assessment Tax Assessment Total Assessment is a certain percentage of the fair market value that is determined by local assessors to be the total taxable value of land and additions on the property. | Land | Improvement |
|---|---|---|---|---|
| 2025 | $2,935 | $471,050 | $100,000 | $371,050 |
| 2024 | $2,859 | $462,000 | $100,000 | $362,000 |
| 2023 | $2,807 | $455,000 | $74,000 | $381,000 |
| 2022 | $2,821 | $470,000 | $50,000 | $420,000 |
| 2021 | $2,228 | $334,000 | $50,000 | $284,000 |
| 2020 | $2,046 | $281,000 | $69,945 | $211,055 |
| 2019 | $1,897 | $244,000 | $40,016 | $203,984 |
| 2018 | $1,626 | $194,000 | $37,998 | $156,002 |
| 2017 | $1,714 | $194,000 | $34,990 | $159,010 |
| 2016 | $1,537 | $92,665 | $16,500 | $76,165 |
| 2015 | $1,374 | $84,141 | $16,500 | $67,641 |
| 2014 | $1,428 | $87,054 | $17,050 | $70,004 |
Source: Public Records
Map
Nearby Homes
- 2105 W 5700 S
- 2190 W 5700 S
- 2552 N 2125 W
- 2419 W 5850 S
- 5643 S 2200 W
- 484 W 2650 N
- 2146 W 5600 S Unit 29
- 2078 W 5600 S
- 5545 S 2100 W Unit 12
- 5545 S 2100 W Unit 20
- 5545 S 2100 W Unit D22
- 2612 N 525 W
- 2593 N 500 W Unit 56
- 2182 W 5600 S Unit 16
- 2349 Chateau Dr
- 2512 N 475 W
- 5547 S 2150 W
- 5495 S 2100 W
- 5810 S 2550 W
- 2564 W 5950 S