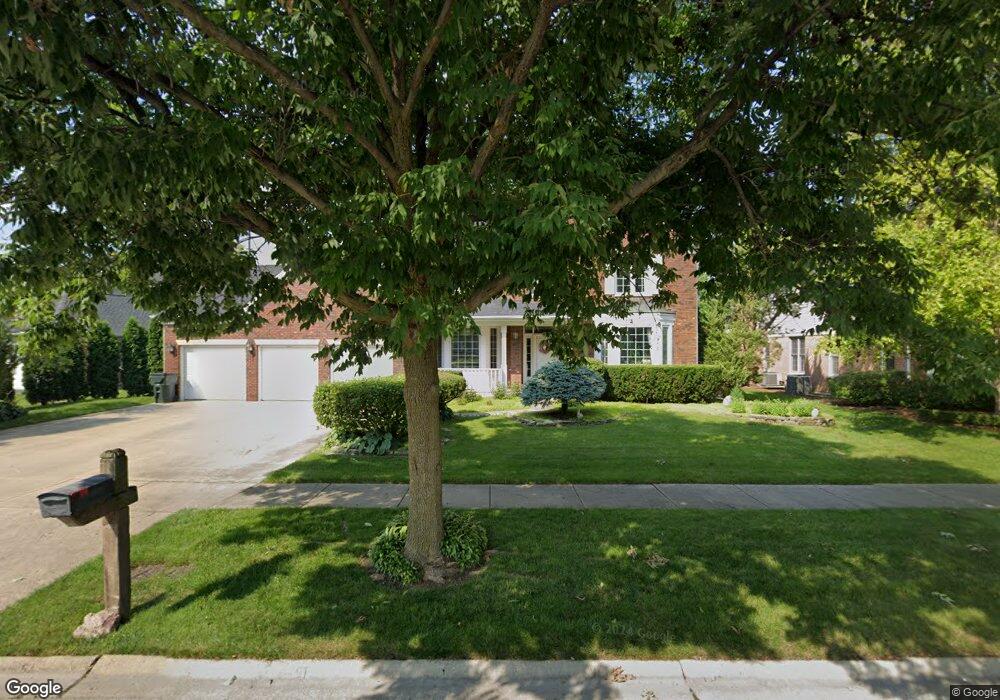
2111 Warwick Ln Glenview, IL 60026
The Willows NeighborhoodEstimated Value: $974,890 - $1,278,000
4
Beds
3
Baths
3,193
Sq Ft
$341/Sq Ft
Est. Value
About This Home
This home is located at 2111 Warwick Ln, Glenview, IL 60026 and is currently estimated at $1,087,473, approximately $340 per square foot. 2111 Warwick Ln is a home located in Cook County with nearby schools including Westbrook Elementary School, Glen Grove Elementary School, and Attea Middle School.
Ownership History
Date
Name
Owned For
Owner Type
Purchase Details
Closed on
Feb 20, 2020
Sold by
Beranek Marlene and Marlene Beranek Revocable Trus
Bought by
Beranek Kurt and Beranek Marlene
Current Estimated Value
Home Financials for this Owner
Home Financials are based on the most recent Mortgage that was taken out on this home.
Original Mortgage
$640,000
Outstanding Balance
$564,706
Interest Rate
3.75%
Mortgage Type
New Conventional
Estimated Equity
$522,767
Purchase Details
Closed on
May 12, 2004
Sold by
Beranek Kurt and Beranek Marlene
Bought by
Beranek Marlene and Marlene Beranek Revocable Trust
Purchase Details
Closed on
Dec 1, 2000
Sold by
Hillstrand Marilyn M
Bought by
Beranek Kurt and Beranek Marlene
Purchase Details
Closed on
Feb 24, 2000
Sold by
Declaratio Hillstrand Ronald L
Bought by
Declarati Hillstrand Marilyn M and Marilyn M Hillstrand Declaration Trust
Purchase Details
Closed on
Feb 22, 1995
Sold by
Hillstrand Ronald L and Hillstrand Marilyn M
Bought by
Hillstrand Ronald L and Hillstrand Marilyn M
Create a Home Valuation Report for This Property
The Home Valuation Report is an in-depth analysis detailing your home's value as well as a comparison with similar homes in the area
Home Values in the Area
Average Home Value in this Area
Purchase History
| Date | Buyer | Sale Price | Title Company |
|---|---|---|---|
| Beranek Kurt | -- | Acquest Title Services Llc | |
| Beranek Marlene | -- | -- | |
| Beranek Kurt | $720,000 | Chicago Title Insurance Co | |
| Declarati Hillstrand Marilyn M | -- | -- | |
| Hillstrand Ronald L | -- | -- |
Source: Public Records
Mortgage History
| Date | Status | Borrower | Loan Amount |
|---|---|---|---|
| Open | Beranek Kurt | $640,000 |
Source: Public Records
Tax History
| Year | Tax Paid | Tax Assessment Tax Assessment Total Assessment is a certain percentage of the fair market value that is determined by local assessors to be the total taxable value of land and additions on the property. | Land | Improvement |
|---|---|---|---|---|
| 2025 | $15,808 | $97,000 | $30,100 | $66,900 |
| 2024 | $15,808 | $77,391 | $25,200 | $52,191 |
| 2023 | $15,322 | $77,391 | $25,200 | $52,191 |
| 2022 | $15,322 | $77,391 | $25,200 | $52,191 |
| 2021 | $13,901 | $61,845 | $17,150 | $44,695 |
| 2020 | $13,837 | $61,845 | $17,150 | $44,695 |
| 2019 | $13,046 | $68,717 | $17,150 | $51,567 |
| 2018 | $13,972 | $66,936 | $15,050 | $51,886 |
| 2017 | $13,624 | $66,936 | $15,050 | $51,886 |
| 2016 | $14,118 | $71,023 | $15,050 | $55,973 |
| 2015 | $12,218 | $55,803 | $12,250 | $43,553 |
| 2014 | $12,639 | $56,633 | $12,250 | $44,383 |
| 2013 | $12,956 | $59,794 | $12,250 | $47,544 |
Source: Public Records
Map
Nearby Homes
- 3820 Kiess Dr
- 3800 Kiess Dr
- 3501 Lawson Rd
- 4142 Hampton Ct
- 3246 Landwehr Rd Unit 3
- 3190 Landwehr Rd
- 3849 Grace Ln
- 3256 Westview Dr
- 1605 Elmdale Ave
- 1594 Portage Run
- 1615 Greenwood Rd
- 3240 Brookdale Ln
- 2308 Indian Ridge Dr
- 4408 Hammersmith Ln
- 2571 Essex Dr
- 2803 Wildflower Ct
- 2533 Windsor Ln
- 2501 Indian Ridge Dr
- 3005 Highland Rd
- 3404 Salem Walk
- 2107 Warwick Ln
- 2115 Warwick Ln
- 3610 W Lake Ave
- 3610 W Lake Ave
- 3620 Glenlake Dr
- 3624 Glenlake Dr
- 2106 Warwick Ln
- 2123 Warwick Ln
- 2118 Warwick Ln
- 2102 Warwick Ln
- 2122 Warwick Ln
- 2110 Warwick Ln
- 2126 Warwick Ln
- 3616 Glenlake Dr
- 2114 Warwick Ln
- 2104 Norwich Ct
- 2127 Warwick Ln
- 2067 Glenlake Dr
- 2102 Norwich Ct
- 3716 Glenlake Dr
Your Personal Tour Guide
Ask me questions while you tour the home.