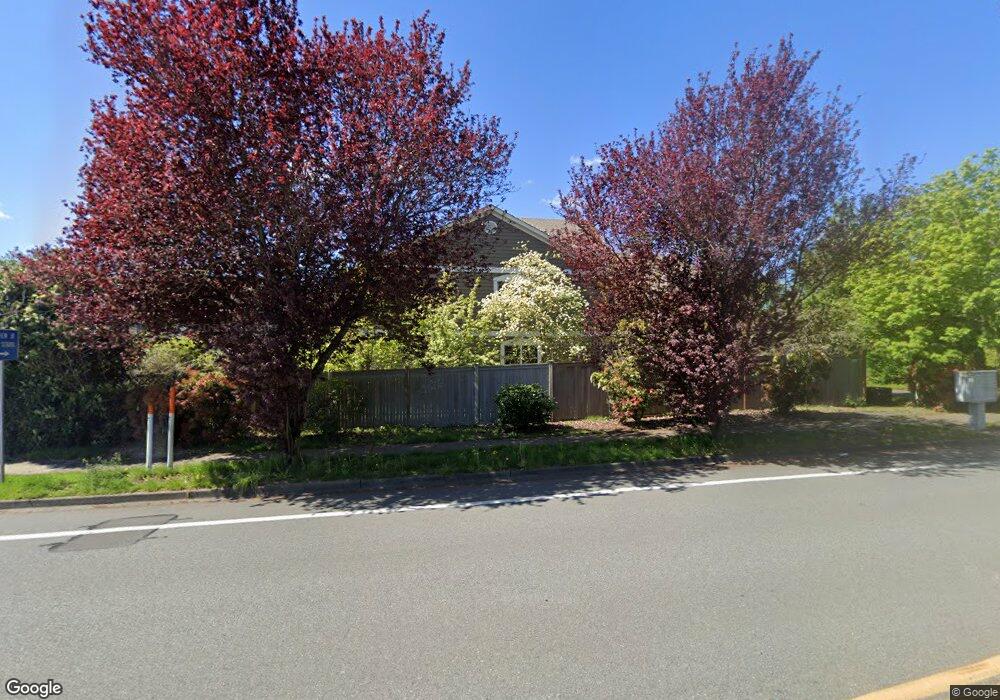
21112 39th Ave SE Unit Lt 4A Bothell, WA 98021
Canyon Creek NeighborhoodEstimated Value: $1,419,000 - $1,617,000
5
Beds
3
Baths
2,912
Sq Ft
$514/Sq Ft
Est. Value
About This Home
This home is located at 21112 39th Ave SE Unit Lt 4A, Bothell, WA 98021 and is currently estimated at $1,496,772, approximately $514 per square foot. 21112 39th Ave SE Unit Lt 4A is a home located in Snohomish County with nearby schools including Canyon Creek Elementary School, Skyview Middle School, and North Creek High School.
Ownership History
Date
Name
Owned For
Owner Type
Purchase Details
Closed on
Oct 17, 2022
Sold by
Shen Wei and Shen Lung
Bought by
Chandramouli Swaminath and Raghunathan Poornima
Current Estimated Value
Home Financials for this Owner
Home Financials are based on the most recent Mortgage that was taken out on this home.
Original Mortgage
$970,251
Outstanding Balance
$925,441
Interest Rate
4.87%
Mortgage Type
New Conventional
Estimated Equity
$571,331
Purchase Details
Closed on
Aug 11, 2005
Sold by
Scharbach Construction Llc
Bought by
Shen Wei and Ho Jung
Home Financials for this Owner
Home Financials are based on the most recent Mortgage that was taken out on this home.
Original Mortgage
$359,650
Interest Rate
5.56%
Mortgage Type
New Conventional
Create a Home Valuation Report for This Property
The Home Valuation Report is an in-depth analysis detailing your home's value as well as a comparison with similar homes in the area
Home Values in the Area
Average Home Value in this Area
Purchase History
| Date | Buyer | Sale Price | Title Company |
|---|---|---|---|
| Chandramouli Swaminath | -- | First American Title | |
| Shen Wei | $484,950 | Chicago |
Source: Public Records
Mortgage History
| Date | Status | Borrower | Loan Amount |
|---|---|---|---|
| Open | Chandramouli Swaminath | $970,251 | |
| Previous Owner | Shen Wei | $359,650 |
Source: Public Records
Tax History Compared to Growth
Tax History
| Year | Tax Paid | Tax Assessment Tax Assessment Total Assessment is a certain percentage of the fair market value that is determined by local assessors to be the total taxable value of land and additions on the property. | Land | Improvement |
|---|---|---|---|---|
| 2025 | $10,055 | $1,246,900 | $679,300 | $567,600 |
| 2024 | $10,055 | $1,124,400 | $595,700 | $528,700 |
| 2023 | $9,978 | $1,243,600 | $698,300 | $545,300 |
| 2022 | $8,986 | $890,400 | $427,500 | $462,900 |
| 2020 | $8,379 | $783,600 | $385,000 | $398,600 |
| 2019 | $7,419 | $701,600 | $306,900 | $394,700 |
| 2018 | $7,055 | $621,300 | $265,100 | $356,200 |
| 2017 | $6,103 | $546,800 | $213,900 | $332,900 |
| 2016 | $5,880 | $514,200 | $195,300 | $318,900 |
| 2015 | $5,774 | $479,700 | $175,500 | $304,200 |
| 2013 | $5,327 | $394,000 | $135,200 | $258,800 |
Source: Public Records
Map
Nearby Homes
- 21403 39th Dr SE Unit B
- 21407 39th Dr SE Unit A
- 3918 214th Place SE Unit A
- 3928 214th Place SE Unit A
- 3928 214th Place SE Unit B
- 3926 214th Place SE Unit B
- 4001 215th St SE Unit A
- 20615 39th Ave SE
- 21713 38th Dr SE
- 3207 212th St SE
- 4403 216th Place SE
- 3721 219th Place SE Unit 41
- 21903 41st Ave SE
- 4426 216th Place SE
- 20911 30th Dr SE
- 4223 220th St SE
- 4219 220th St SE
- 4215 220th St SE
- 3014 213th St SE
- 4131 220th St SE
- 21112 39th Ave SE
- 21108 39th Ave SE
- 21108 39th Ave SE Unit Lt 3A
- 21119 38th Dr SE
- 21125 38th Dr SE
- 21104 39th Ave SE
- 21104 39th Ave SE Unit Lt 2A
- 21030 39th Ave SE
- 21131 38th Dr SE
- 21118 38th Dr SE
- 3911 211th Place SE
- 21102 39th Ave SE
- 21102 39th Ave SE Unit Lt 1A
- 3913 211th Place SE
- 3906 211th Place SE
- 21124 38th Dr SE
- 21018 39th Dr SE
- 21027 39th Dr SE
- 21130 38th Dr SE