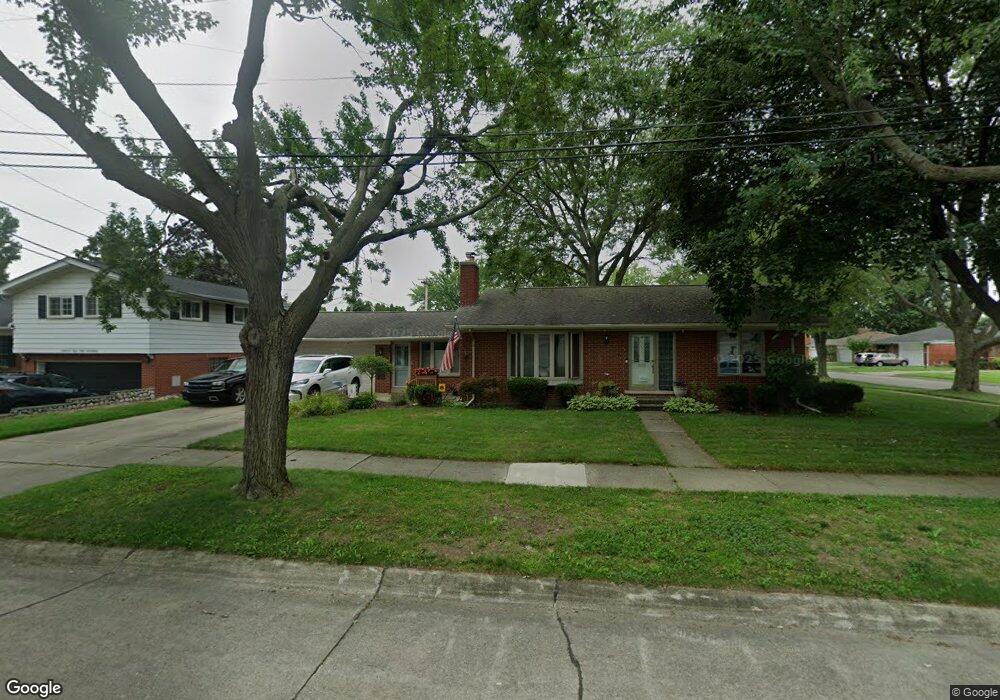
21112 Violet St Saint Clair Shores, MI 48082
Estimated Value: $265,000 - $302,000
2
Beds
2
Baths
1,400
Sq Ft
$200/Sq Ft
Est. Value
About This Home
This home is located at 21112 Violet St, Saint Clair Shores, MI 48082 and is currently estimated at $279,792, approximately $199 per square foot. 21112 Violet St is a home located in Macomb County with nearby schools including Rodgers Elementary School, Kennedy Middle School, and Lake Shore High School.
Ownership History
Date
Name
Owned For
Owner Type
Purchase Details
Closed on
Jun 21, 2019
Sold by
Leto Carrie L and Grantz Carrie L
Bought by
Lapoila John E and Lapoila Kimberly A
Current Estimated Value
Home Financials for this Owner
Home Financials are based on the most recent Mortgage that was taken out on this home.
Original Mortgage
$137,600
Outstanding Balance
$120,984
Interest Rate
4.1%
Mortgage Type
New Conventional
Estimated Equity
$158,808
Purchase Details
Closed on
Mar 5, 2019
Sold by
Granitz Carrie L and Granitz Steven A
Bought by
Granitz Carrie L
Purchase Details
Closed on
Dec 5, 2014
Sold by
Moore Valihora Paula and Moore Paula Wybrandt
Bought by
Granitz Steven A and Granitz Carrie L
Home Financials for this Owner
Home Financials are based on the most recent Mortgage that was taken out on this home.
Original Mortgage
$137,464
Interest Rate
4.4%
Mortgage Type
FHA
Purchase Details
Closed on
May 16, 2008
Sold by
Houston Theresa K and Estate Of Genevieve Eileen Koc
Bought by
Moore Paula Wybrandt
Create a Home Valuation Report for This Property
The Home Valuation Report is an in-depth analysis detailing your home's value as well as a comparison with similar homes in the area
Home Values in the Area
Average Home Value in this Area
Purchase History
| Date | Buyer | Sale Price | Title Company |
|---|---|---|---|
| Lapoila John E | $172,000 | Premier Title Agency Llc | |
| Granitz Carrie L | -- | None Available | |
| Granitz Steven A | $140,000 | None Available | |
| Moore Paula Wybrandt | $140,000 | Capital Title Ins Agency |
Source: Public Records
Mortgage History
| Date | Status | Borrower | Loan Amount |
|---|---|---|---|
| Open | Lapoila John E | $137,600 | |
| Previous Owner | Granitz Steven A | $137,464 |
Source: Public Records
Tax History Compared to Growth
Tax History
| Year | Tax Paid | Tax Assessment Tax Assessment Total Assessment is a certain percentage of the fair market value that is determined by local assessors to be the total taxable value of land and additions on the property. | Land | Improvement |
|---|---|---|---|---|
| 2025 | $4,731 | $136,200 | $0 | $0 |
| 2024 | $4,585 | $123,700 | $0 | $0 |
| 2023 | $4,358 | $108,000 | $0 | $0 |
| 2022 | $4,265 | $96,700 | $0 | $0 |
| 2021 | $4,187 | $89,500 | $0 | $0 |
| 2020 | $4,073 | $83,500 | $0 | $0 |
| 2019 | $2,655 | $76,000 | $0 | $0 |
| 2018 | $3,039 | $70,800 | $0 | $0 |
| 2017 | $2,862 | $67,800 | $10,800 | $57,000 |
| 2016 | $2,655 | $67,800 | $0 | $0 |
| 2015 | $2,788 | $50,500 | $0 | $0 |
| 2012 | -- | $45,400 | $9,900 | $35,500 |
Source: Public Records
Map
Nearby Homes
- 21301 Violet St
- 31005 Champine St
- 21135 Hoffman St
- 31031 Champine St
- 21217 Raymond St
- 21720 Evergreen St
- 20551 Fenton St
- 20922 Hunt Dr
- 20938 Hunt Dr Unit 52
- 21542 Lakebreeze St
- 20887 Flora St
- 20825 Washington St
- 20731 Washington St
- 29563 Little MacK Ave
- 31751 Nardelli Ln
- 20226 Fenton St
- 22224 Violet St
- 22217 Dorion St
- 29254 Harding St
- 31931 Courtland St
- 30712 Champine St
- 21200 Violet St
- 30708 Champine St
- 21204 Violet St
- 21115 Violet St
- 21201 Violet St
- 30713 Champine St
- 21109 Violet St
- 21201 Evergreen St
- 21208 Violet St
- 30704 Champine St
- 30709 Champine St
- 21205 Violet St
- 21205 Evergreen St
- 21105 Violet St
- 30705 Champine St
- 21212 Violet St
- 21209 Evergreen St
- 21209 Violet St
- 21101 Violet St