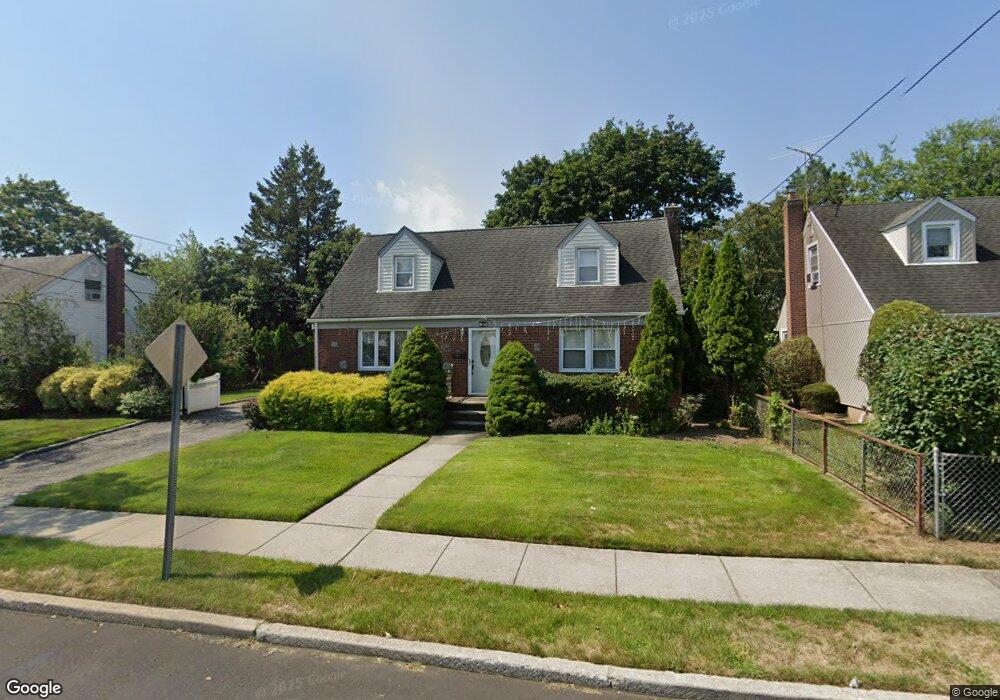
2112 4th St East Meadow, NY 11554
Estimated Value: $744,000 - $822,896
5
Beds
2
Baths
1,554
Sq Ft
$504/Sq Ft
Est. Value
About This Home
This home is located at 2112 4th St, East Meadow, NY 11554 and is currently estimated at $783,448, approximately $504 per square foot. 2112 4th St is a home located in Nassau County with nearby schools including Kellenberg Memorial High School.
Ownership History
Date
Name
Owned For
Owner Type
Purchase Details
Closed on
Nov 2, 2011
Sold by
Mavlios Michael and Mavlios Evangelia G
Bought by
Oonnoonny Sunnykutty and Sunnykutty Annamm
Current Estimated Value
Home Financials for this Owner
Home Financials are based on the most recent Mortgage that was taken out on this home.
Original Mortgage
$295,200
Outstanding Balance
$200,323
Interest Rate
3.92%
Mortgage Type
Purchase Money Mortgage
Estimated Equity
$583,125
Purchase Details
Closed on
Feb 6, 1999
Sold by
Settipani Antonina
Bought by
Mavlios Michael
Create a Home Valuation Report for This Property
The Home Valuation Report is an in-depth analysis detailing your home's value as well as a comparison with similar homes in the area
Home Values in the Area
Average Home Value in this Area
Purchase History
| Date | Buyer | Sale Price | Title Company |
|---|---|---|---|
| Oonnoonny Sunnykutty | $369,000 | -- | |
| Mavlios Michael | $175,000 | -- |
Source: Public Records
Mortgage History
| Date | Status | Borrower | Loan Amount |
|---|---|---|---|
| Open | Oonnoonny Sunnykutty | $295,200 |
Source: Public Records
Tax History Compared to Growth
Tax History
| Year | Tax Paid | Tax Assessment Tax Assessment Total Assessment is a certain percentage of the fair market value that is determined by local assessors to be the total taxable value of land and additions on the property. | Land | Improvement |
|---|---|---|---|---|
| 2025 | $11,607 | $479 | $224 | $255 |
| 2024 | $4,083 | $549 | $257 | $292 |
| 2023 | $10,228 | $522 | $244 | $278 |
| 2022 | $10,228 | $549 | $257 | $292 |
| 2021 | $14,257 | $518 | $243 | $275 |
| 2020 | $9,422 | $602 | $601 | $1 |
| 2019 | $8,863 | $602 | $601 | $1 |
| 2018 | $8,377 | $627 | $0 | $0 |
| 2017 | $4,959 | $627 | $600 | $27 |
| 2016 | $7,877 | $664 | $524 | $140 |
| 2015 | $3,085 | $701 | $478 | $223 |
| 2014 | $3,085 | $701 | $478 | $223 |
| 2013 | $3,038 | $738 | $542 | $196 |
Source: Public Records
Map
Nearby Homes