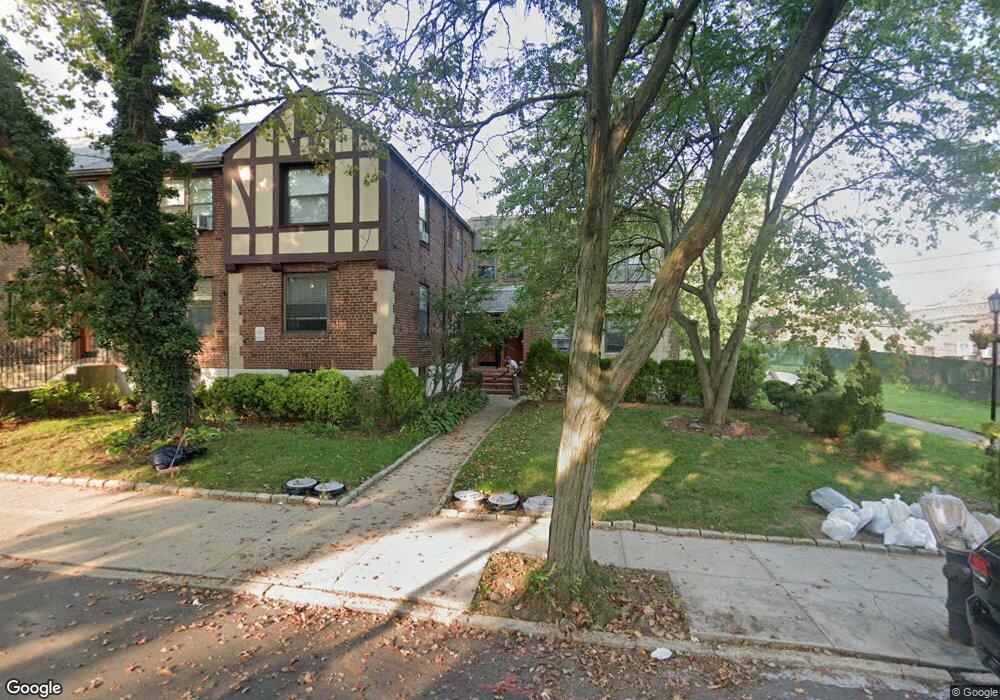
2112 78th St Unit 2 East Elmhurst, NY 11370
Ditmars Steinway NeighborhoodEstimated Value: $371,000 - $490,000
--
Bed
--
Bath
839
Sq Ft
$548/Sq Ft
Est. Value
About This Home
This home is located at 2112 78th St Unit 2, East Elmhurst, NY 11370 and is currently estimated at $459,944, approximately $548 per square foot. 2112 78th St Unit 2 is a home located in Queens County with nearby schools including P.S. 2 Alfred Zimberg, Is 141 The Steinway, and William Cullen Bryant High School.
Ownership History
Date
Name
Owned For
Owner Type
Purchase Details
Closed on
Jun 28, 2016
Sold by
Deda Antoneta and Deda Nikolin
Bought by
Ismalaja Ilda
Current Estimated Value
Home Financials for this Owner
Home Financials are based on the most recent Mortgage that was taken out on this home.
Original Mortgage
$0
Interest Rate
3.66%
Mortgage Type
Unknown
Purchase Details
Closed on
May 31, 2007
Sold by
Sharafshahi Soudabeh
Bought by
Deda Antoneta and Deda Nikolin
Home Financials for this Owner
Home Financials are based on the most recent Mortgage that was taken out on this home.
Original Mortgage
$284,000
Interest Rate
6.19%
Mortgage Type
Purchase Money Mortgage
Purchase Details
Closed on
Jul 9, 1998
Sold by
Giglia Francesca and Medina Armando
Bought by
Sharafshahi Soudabeh
Create a Home Valuation Report for This Property
The Home Valuation Report is an in-depth analysis detailing your home's value as well as a comparison with similar homes in the area
Home Values in the Area
Average Home Value in this Area
Purchase History
| Date | Buyer | Sale Price | Title Company |
|---|---|---|---|
| Ismalaja Ilda | $395,000 | -- | |
| Ismalaja Ilda | $395,000 | -- | |
| Deda Antoneta | $355,000 | -- | |
| Deda Antoneta | $355,000 | -- | |
| Sharafshahi Soudabeh | $95,000 | Chicago Title Insurance Co | |
| Sharafshahi Soudabeh | $95,000 | Chicago Title Insurance Co |
Source: Public Records
Mortgage History
| Date | Status | Borrower | Loan Amount |
|---|---|---|---|
| Closed | Ismalaja Ilda | $0 | |
| Open | Ismalaja Ilda | $280,000 | |
| Closed | Ismalaja Ilda | $280,000 | |
| Previous Owner | Deda Antoneta | $284,000 |
Source: Public Records
Tax History Compared to Growth
Tax History
| Year | Tax Paid | Tax Assessment Tax Assessment Total Assessment is a certain percentage of the fair market value that is determined by local assessors to be the total taxable value of land and additions on the property. | Land | Improvement |
|---|---|---|---|---|
| 2025 | $5,235 | $41,771 | $7,023 | $34,748 |
| 2024 | $3,764 | $41,876 | $7,023 | $34,853 |
| 2023 | $5,162 | $41,287 | $7,023 | $34,264 |
| 2022 | $3,600 | $40,921 | $7,023 | $33,898 |
| 2021 | $3,543 | $40,171 | $7,023 | $33,148 |
| 2020 | $3,552 | $44,470 | $7,023 | $37,447 |
| 2019 | $3,306 | $43,582 | $7,023 | $36,559 |
| 2018 | $4,192 | $32,960 | $7,023 | $25,937 |
| 2017 | $3,720 | $29,246 | $7,023 | $22,223 |
| 2016 | $3,484 | $29,246 | $7,023 | $22,223 |
| 2015 | $1,649 | $24,889 | $7,023 | $17,866 |
| 2014 | $1,649 | $23,073 | $7,023 | $16,050 |
Source: Public Records
Map
Nearby Homes
- 21-16 77 Street 2nd Floor
- 21-40 78th St Unit 2
- 19-65 79th St Unit 2C
- 21-14 80th St
- 76-12 Ditmars Blvd Unit B3
- 1950 80th St Unit 1
- 19-50 80th St Unit 1
- 21-43 80th St
- 2220 78th St Unit A3
- 19-44 78th St
- 2209 76th St Unit C2
- 2208 76th St Unit A3
- 22-27 76 St Unit B2
- 22-39 78 St
- 22-28 77th St Unit C1
- 19-49 80th St
- 22-31 77th St Unit C2
- 2205 80th St
- 2134 74th St
- 22-40 80th St Unit 2B
- 2114 78th St Unit 2
- 2114 78th St Unit 1
- 21-14 78th St Unit 1
- 21-14 78th St
- 21-14 78th St Unit 2
- 21-14 78th St Unit 1-2
- 2112 78th St Unit 1
- 2116 78th St Unit 2
- 2116 78th St Unit 1
- 2118 78th St Unit 1D
- 2118 78th St Unit 1
- 2118 78th St Unit 2D
- 2120 78th St Unit 2
- 2120 78th St Unit 1
- 2124 78th St Unit 1
- 2124 78th St Unit 2
- 21-24 78th St Unit 1
- 21-24 78th St
- 2113 77th St Unit 2
- 2113 77th St Unit 1