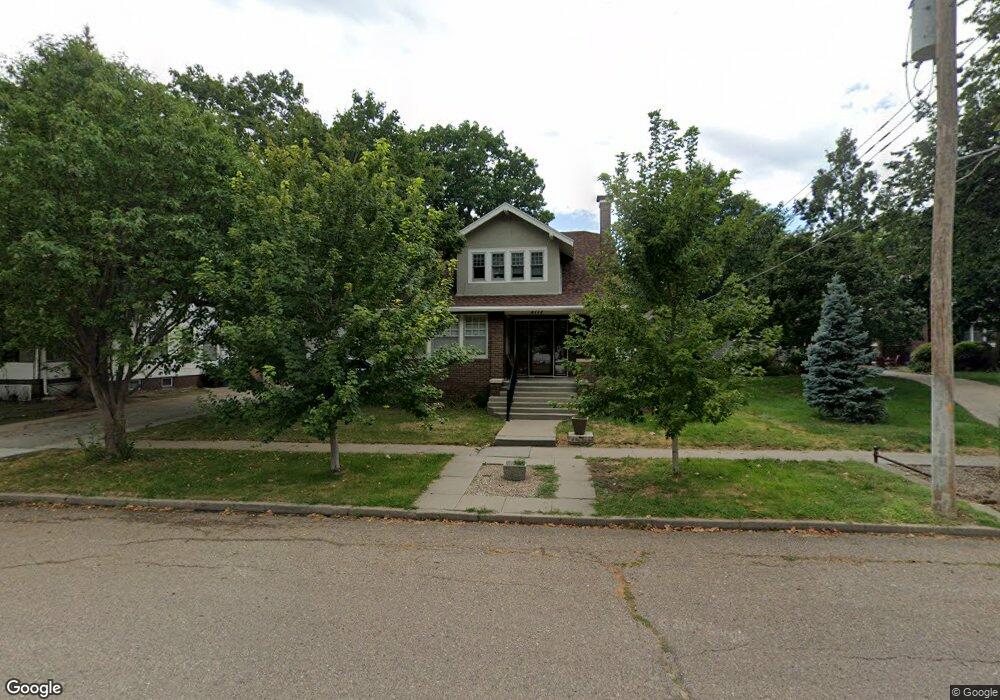
2112 8th Ave Kearney, NE 68845
Estimated Value: $280,000 - $389,702
4
Beds
3
Baths
1,793
Sq Ft
$194/Sq Ft
Est. Value
About This Home
This home is located at 2112 8th Ave, Kearney, NE 68845 and is currently estimated at $347,176, approximately $193 per square foot. 2112 8th Ave is a home located in Buffalo County with nearby schools including Central Elementary School, Horizon Middle School, and Kearney Senior High School.
Ownership History
Date
Name
Owned For
Owner Type
Purchase Details
Closed on
Dec 6, 2022
Sold by
Fox Family Revocable Trust
Bought by
Morris John Ca and Morris Megan G
Current Estimated Value
Home Financials for this Owner
Home Financials are based on the most recent Mortgage that was taken out on this home.
Original Mortgage
$162,163
Outstanding Balance
$157,412
Interest Rate
7.08%
Mortgage Type
New Conventional
Estimated Equity
$189,764
Purchase Details
Closed on
Feb 15, 2018
Sold by
Fox Robert P and Fox Rachel L
Bought by
Fox Robert P and Fox Rachel L
Purchase Details
Closed on
Oct 21, 2015
Sold by
Morris Rochelle L and Morris Scott D
Bought by
Fox Robert P and Fox Rachel L
Purchase Details
Closed on
Jul 23, 2015
Sold by
Morris Scott D and Jensen Rochelle L
Bought by
Morris Rochelle L
Purchase Details
Closed on
Aug 4, 2014
Sold by
Richard L Richard L and Butler Jeanne M
Bought by
Jensen Rochelle L
Create a Home Valuation Report for This Property
The Home Valuation Report is an in-depth analysis detailing your home's value as well as a comparison with similar homes in the area
Home Values in the Area
Average Home Value in this Area
Purchase History
| Date | Buyer | Sale Price | Title Company |
|---|---|---|---|
| Morris John Ca | $350,000 | Central Nebraska Title | |
| Fox Robert P | -- | None Available | |
| Fox Robert P | $230,000 | Central Nebraska Title | |
| Morris Rochelle L | -- | None Available | |
| Jensen Rochelle L | -- | Barney |
Source: Public Records
Mortgage History
| Date | Status | Borrower | Loan Amount |
|---|---|---|---|
| Open | Morris John Ca | $162,163 |
Source: Public Records
Tax History
| Year | Tax Paid | Tax Assessment Tax Assessment Total Assessment is a certain percentage of the fair market value that is determined by local assessors to be the total taxable value of land and additions on the property. | Land | Improvement |
|---|---|---|---|---|
| 2025 | $3,778 | $294,005 | $26,440 | $267,565 |
| 2024 | $4,844 | $316,965 | $25,670 | $291,295 |
| 2023 | $4,844 | $284,590 | $25,670 | $258,920 |
| 2022 | $4,943 | $281,695 | $24,690 | $257,005 |
| 2021 | $4,557 | $264,235 | $24,470 | $239,765 |
| 2020 | $4,513 | $260,915 | $24,470 | $236,445 |
| 2019 | $4,477 | $255,700 | $24,470 | $231,230 |
| 2018 | $3,963 | $229,600 | $24,470 | $205,130 |
| 2017 | $3,685 | $214,930 | $24,470 | $190,460 |
| 2016 | $3,279 | $192,805 | $24,470 | $168,335 |
| 2014 | $2,482 | $130,200 | $0 | $0 |
Source: Public Records
Map
Nearby Homes
Your Personal Tour Guide
Ask me questions while you tour the home.