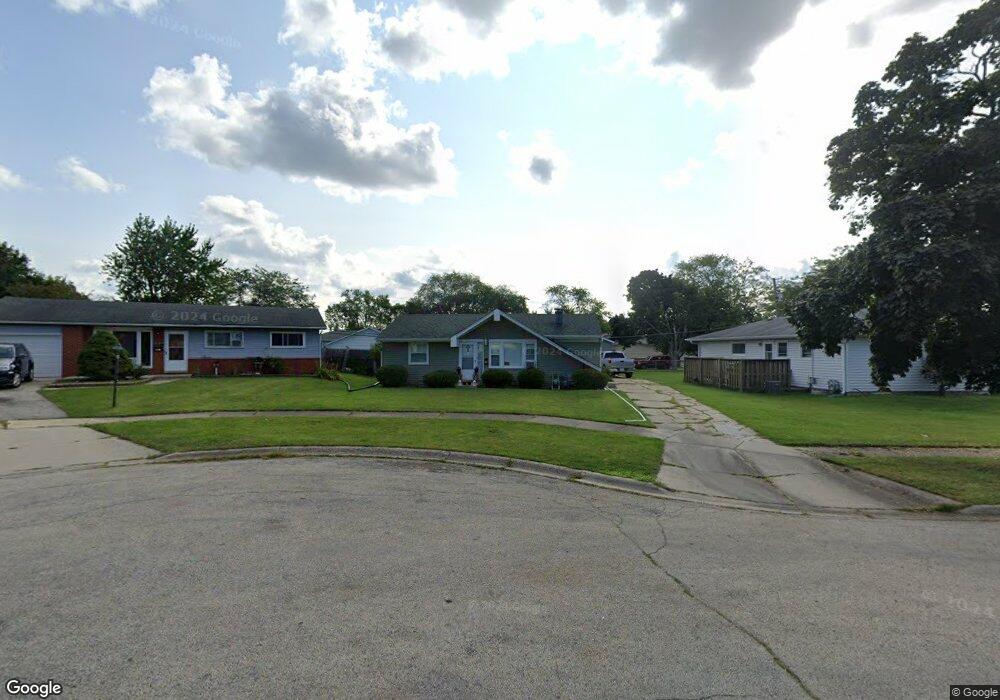
2112 Castle Ct Waukegan, IL 60087
Estimated Value: $173,000 - $255,000
3
Beds
1
Bath
1,053
Sq Ft
$213/Sq Ft
Est. Value
About This Home
This home is located at 2112 Castle Ct, Waukegan, IL 60087 and is currently estimated at $223,883, approximately $212 per square foot. 2112 Castle Ct is a home located in Lake County with nearby schools including H R McCall Elementary School, Jack Benny Middle School, and Waukegan High School.
Ownership History
Date
Name
Owned For
Owner Type
Purchase Details
Closed on
Apr 9, 2008
Sold by
Rueda Jose and Rueda Anthony
Bought by
Rueda Anthony and Diaz Rueda Blanca
Current Estimated Value
Home Financials for this Owner
Home Financials are based on the most recent Mortgage that was taken out on this home.
Original Mortgage
$152,840
Outstanding Balance
$97,422
Interest Rate
6.09%
Mortgage Type
New Conventional
Estimated Equity
$126,461
Purchase Details
Closed on
Oct 28, 2004
Sold by
Palms Bart D
Bought by
Rueda Jose
Home Financials for this Owner
Home Financials are based on the most recent Mortgage that was taken out on this home.
Original Mortgage
$129,010
Interest Rate
5.25%
Mortgage Type
New Conventional
Purchase Details
Closed on
Apr 2, 2004
Sold by
Perez Josue
Bought by
Palms Bart D
Purchase Details
Closed on
Apr 10, 2000
Sold by
Zeka David L and Zeka Joann L
Bought by
Perez Josue
Home Financials for this Owner
Home Financials are based on the most recent Mortgage that was taken out on this home.
Original Mortgage
$101,841
Interest Rate
8.18%
Mortgage Type
FHA
Create a Home Valuation Report for This Property
The Home Valuation Report is an in-depth analysis detailing your home's value as well as a comparison with similar homes in the area
Home Values in the Area
Average Home Value in this Area
Purchase History
| Date | Buyer | Sale Price | Title Company |
|---|---|---|---|
| Rueda Anthony | -- | Multiple | |
| Rueda Jose | $133,000 | Multiple | |
| Palms Bart D | $12,000 | -- | |
| Perez Josue | $102,000 | Collar Counties Title Plant |
Source: Public Records
Mortgage History
| Date | Status | Borrower | Loan Amount |
|---|---|---|---|
| Open | Rueda Anthony | $152,840 | |
| Closed | Rueda Jose | $129,010 | |
| Previous Owner | Perez Josue | $101,841 |
Source: Public Records
Tax History Compared to Growth
Tax History
| Year | Tax Paid | Tax Assessment Tax Assessment Total Assessment is a certain percentage of the fair market value that is determined by local assessors to be the total taxable value of land and additions on the property. | Land | Improvement |
|---|---|---|---|---|
| 2024 | $4,264 | $58,910 | $10,239 | $48,671 |
| 2023 | $3,648 | $53,220 | $9,250 | $43,970 |
| 2022 | $3,648 | $43,319 | $7,931 | $35,388 |
| 2021 | $3,947 | $43,854 | $7,554 | $36,300 |
| 2020 | $3,951 | $40,855 | $7,037 | $33,818 |
| 2019 | $3,664 | $37,437 | $6,448 | $30,989 |
| 2018 | $3,130 | $32,648 | $8,298 | $24,350 |
| 2017 | $2,996 | $28,884 | $7,341 | $21,543 |
| 2016 | $2,707 | $25,099 | $6,379 | $18,720 |
| 2015 | $2,542 | $21,048 | $5,709 | $15,339 |
| 2014 | $2,471 | $20,147 | $6,135 | $14,012 |
| 2012 | $3,283 | $21,826 | $6,646 | $15,180 |
Source: Public Records
Map
Nearby Homes
- 3211 Rugby Ct
- 3101 Country Club Ln
- 3411 N Lewis Ave
- 37966 N Cornell Rd
- 1636 Rice St
- 1612 Whitney St
- 1730 W Beach Rd
- 2613 N Lewis Ave
- 12312 W Audrey Ave
- 38127 N Shore Ave
- 38362 N Manor Ave
- 38683 N Lewis Ave
- 37905 N Loyola Ave
- 2708 Dana Ave
- 2705 Dana Ave
- 2350 N Lewis Ave
- 12582 W Beach Rd
- 38697 N Cedar Ave
- 2713 Varonen Ave
- 36955 N Garrick Ave
- 2110 Kingston Rd
- 2114 Castle Ct
- 3212 Newcastle Rd
- 3208 Newcastle Rd
- 3216 Newcastle Rd
- 3220 Newcastle Rd
- 2124 Castle Ct
- 2126 Kingston Rd
- 2118 Castle Ct
- 2109 Kingston Rd
- 2113 Kingston Rd
- 2120 Castle Ct
- 3224 Newcastle Rd
- 2117 Kingston Rd
- 2105 Kingston Rd
- 2121 Kingston Rd
- 3200 Newcastle Rd
- 3228 Newcastle Rd
- 3209 Newcastle Rd
- 2125 Kingston Rd Unit 2