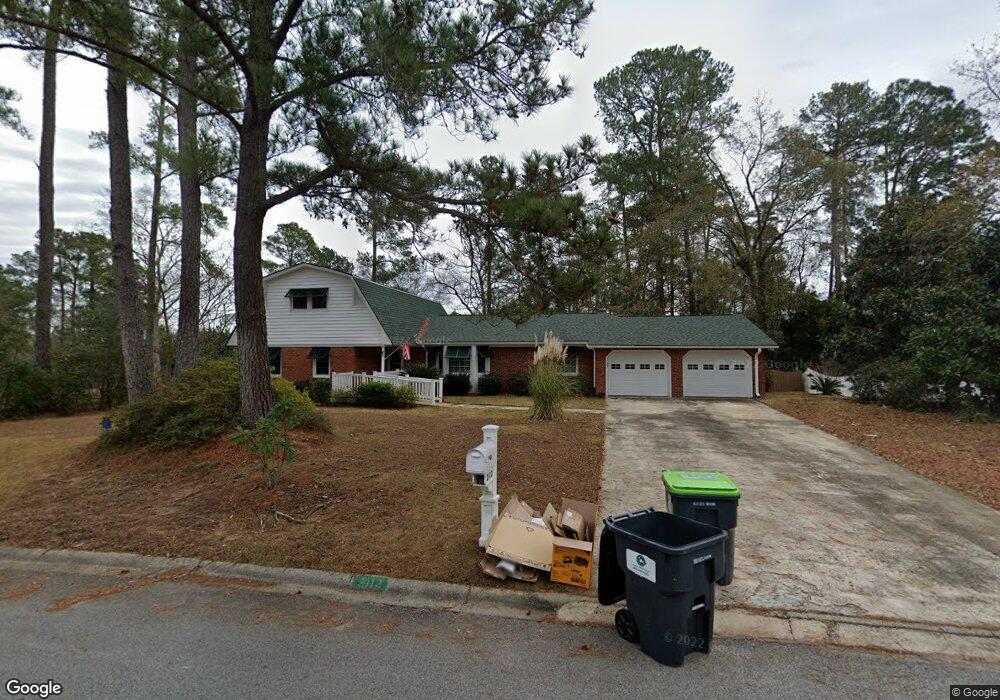
2112 Chipmunk Ln West Columbia, SC 29169
Estimated Value: $390,203 - $428,000
4
Beds
4
Baths
2,976
Sq Ft
$139/Sq Ft
Est. Value
About This Home
This home is located at 2112 Chipmunk Ln, West Columbia, SC 29169 and is currently estimated at $413,551, approximately $138 per square foot. 2112 Chipmunk Ln is a home located in Lexington County with nearby schools including Riverbank Elementary, Northside Middle, and Brookland-Cayce High School.
Ownership History
Date
Name
Owned For
Owner Type
Purchase Details
Closed on
Nov 1, 2021
Sold by
White Judy Kaye
Bought by
Watson William and Chapman Shannon
Current Estimated Value
Home Financials for this Owner
Home Financials are based on the most recent Mortgage that was taken out on this home.
Original Mortgage
$301,500
Outstanding Balance
$275,848
Interest Rate
2.88%
Mortgage Type
New Conventional
Estimated Equity
$137,703
Purchase Details
Closed on
Oct 7, 2021
Sold by
White Frank T and Estate Of Betsy Peele Lillard
Bought by
White Judy Kaye
Home Financials for this Owner
Home Financials are based on the most recent Mortgage that was taken out on this home.
Original Mortgage
$301,500
Outstanding Balance
$275,848
Interest Rate
2.88%
Mortgage Type
New Conventional
Estimated Equity
$137,703
Purchase Details
Closed on
Oct 17, 2014
Sold by
Hill Louise L
Bought by
Lillard T R and Lillard Betsy P
Purchase Details
Closed on
May 9, 2014
Sold by
Estate Of John B Hill and Hill Louise L
Bought by
Hill Louise L
Create a Home Valuation Report for This Property
The Home Valuation Report is an in-depth analysis detailing your home's value as well as a comparison with similar homes in the area
Home Values in the Area
Average Home Value in this Area
Purchase History
| Date | Buyer | Sale Price | Title Company |
|---|---|---|---|
| Watson William | $335,000 | None Available | |
| White Judy Kaye | -- | None Available | |
| White Frank T | -- | None Available | |
| Lillard T R | $125,000 | -- | |
| Hill Louise L | -- | -- |
Source: Public Records
Mortgage History
| Date | Status | Borrower | Loan Amount |
|---|---|---|---|
| Open | Watson William | $301,500 |
Source: Public Records
Tax History Compared to Growth
Tax History
| Year | Tax Paid | Tax Assessment Tax Assessment Total Assessment is a certain percentage of the fair market value that is determined by local assessors to be the total taxable value of land and additions on the property. | Land | Improvement |
|---|---|---|---|---|
| 2024 | $1,804 | $13,400 | $1,600 | $11,800 |
| 2023 | $1,898 | $13,400 | $1,600 | $11,800 |
| 2022 | $1,899 | $13,400 | $1,600 | $11,800 |
| 2020 | $764 | $6,339 | $1,124 | $5,215 |
| 2019 | $682 | $5,513 | $1,600 | $3,913 |
| 2018 | $673 | $5,513 | $1,600 | $3,913 |
| 2017 | $644 | $5,513 | $1,600 | $3,913 |
| 2016 | $665 | $5,513 | $1,600 | $3,913 |
| 2014 | $2,809 | $10,739 | $2,400 | $8,339 |
| 2013 | -- | $7,160 | $1,600 | $5,560 |
Source: Public Records
Map
Nearby Homes
- 225 Quail Ln
- 2405 Pine Lake Dr
- 106 Meadowview Ct
- 203 Holly Ridge Ln
- 1802 Pine Lake Dr
- 0 Mathias Rd Unit 511650
- 0 Mathias Rd Unit 592129
- 175 Hulon Greene Place Unit 3
- 184 Lott Ct
- 2637 Pine Lake Dr
- 0 Quail Hollow Ln
- 2720 Hebron Dr
- 240 Saluda Woods Place
- 0 Terrace View Dr
- 55 Holly Ridge Ln
- 1711 Holly Hill Dr
- 4123 Barbara Dr
- 292 Marabou Cir
- 122 Savannah Ln
- 21 Janice Fe Trail
- 2108 Chipmunk Ln
- 2116 Chipmunk Ln
- 2105 Pine Lake Dr
- 0 Chipmunk Ln Unit 366345
- 0 Chipmunk Ln Unit 388968
- 0 Chipmunk Ln Unit 393705
- 2113 Chipmunk Ln
- 1705 Eprata Dr
- 2117 Chipmunk Ln
- 2109 Pine Lake Dr
- 2109 Chipmunk Ln
- 1709 Ephrata Dr
- 2120 Chipmunk Ln
- 2100 Chipmunk Ln
- 2121 Chipmunk Ln
- 2105 Chipmunk Ln
- 2116 Beaver Ln
- 2113 Pine Lake Dr
- 2120 Beaver Ln
- 2124 Chipmunk Ln