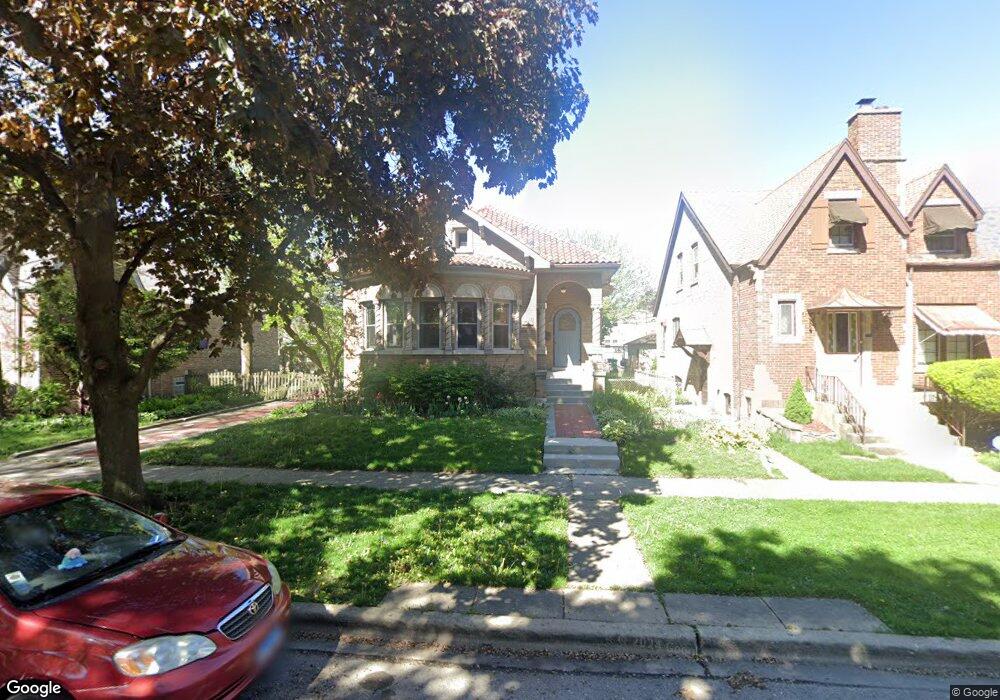
2112 Clarence Ave Berwyn, IL 60402
Estimated Value: $353,010 - $460,000
3
Beds
2
Baths
1,922
Sq Ft
$208/Sq Ft
Est. Value
About This Home
This home is located at 2112 Clarence Ave, Berwyn, IL 60402 and is currently estimated at $400,253, approximately $208 per square foot. 2112 Clarence Ave is a home located in Cook County with nearby schools including Prairie Oak School, Lincoln Middle School, and J Sterling Morton West High School.
Ownership History
Date
Name
Owned For
Owner Type
Purchase Details
Closed on
Oct 15, 2021
Sold by
Ilisca Maureen
Bought by
Janowski Michael and Hartman Kim
Current Estimated Value
Purchase Details
Closed on
Aug 8, 2016
Sold by
Holmes Michael
Bought by
Ilisca Maureen
Home Financials for this Owner
Home Financials are based on the most recent Mortgage that was taken out on this home.
Original Mortgage
$181,600
Interest Rate
3.48%
Mortgage Type
New Conventional
Purchase Details
Closed on
Jun 3, 2016
Sold by
Schiller Properties Llc
Bought by
Holms Michael and The Michael Holmes Trust
Purchase Details
Closed on
Apr 27, 2016
Sold by
Yacono Elizabeth
Bought by
Schiller Properties Llc
Purchase Details
Closed on
Jun 21, 2007
Sold by
Lezatka Emil S
Bought by
Lezatka Emil S and Emil S Lezatka Living Trust
Create a Home Valuation Report for This Property
The Home Valuation Report is an in-depth analysis detailing your home's value as well as a comparison with similar homes in the area
Home Values in the Area
Average Home Value in this Area
Purchase History
| Date | Buyer | Sale Price | Title Company |
|---|---|---|---|
| Janowski Michael | $330,000 | Citywide Title Corporation | |
| Ilisca Maureen | $227,000 | Citywide Title Corporation | |
| Holms Michael | $225,000 | Chicago Title Insurance Comp | |
| Schiller Properties Llc | $115,000 | None Available | |
| Lezatka Emil S | -- | None Available |
Source: Public Records
Mortgage History
| Date | Status | Borrower | Loan Amount |
|---|---|---|---|
| Previous Owner | Ilisca Maureen | $181,600 |
Source: Public Records
Tax History Compared to Growth
Tax History
| Year | Tax Paid | Tax Assessment Tax Assessment Total Assessment is a certain percentage of the fair market value that is determined by local assessors to be the total taxable value of land and additions on the property. | Land | Improvement |
|---|---|---|---|---|
| 2024 | $4,949 | $21,110 | $6,237 | $14,873 |
| 2023 | $3,585 | $21,110 | $6,237 | $14,873 |
| 2022 | $3,585 | $14,488 | $5,405 | $9,083 |
| 2021 | $145 | $14,487 | $5,405 | $9,082 |
| 2020 | $132 | $14,487 | $5,405 | $9,082 |
| 2019 | $162 | $15,626 | $4,885 | $10,741 |
| 2018 | $768 | $5,958 | $4,885 | $1,073 |
| 2017 | $5,038 | $16,765 | $4,885 | $11,880 |
| 2016 | $5,073 | $11,993 | $4,054 | $7,939 |
| 2015 | $2,657 | $11,993 | $4,054 | $7,939 |
| 2014 | $2,529 | $11,993 | $4,054 | $7,939 |
| 2013 | $2,301 | $16,496 | $4,054 | $12,442 |
Source: Public Records
Map
Nearby Homes
- 1932 East Ave
- 2107 East Ave
- 2125 Euclid Ave
- 2102 Gunderson Ave
- 1833 Oak Park Ave
- 1820 Gunderson Ave
- 2115 Kenilworth Ave
- 2302 Scoville Ave
- 1842 Elmwood Ave
- 2212 Grove Ave
- 1631 Clarence Ave
- 1916 Kenilworth Ave
- 1644 Gunderson Ave
- 2310 Gunderson Ave
- 1819 Kenilworth Ave
- 1805 Elmwood Ave
- 1855 Ridgeland Ave
- 2336 Oak Park Ave
- 1648 Kenilworth Ave
- 2418 Wesley Ave
- 2112 Clarence Ave
- 2118 Clarence Ave
- 2108 Clarence Ave
- 2120 Clarence Ave
- 2106 Clarence Ave
- 2122 Clarence Ave
- 2104 Clarence Ave
- 2124 Clarence Ave
- 2115 Wesley Ave
- 2115 Wesley Ave Unit 2
- 2115 Wesley Ave Unit 1
- 2117 Wesley Ave Unit G
- 2117 Wesley Ave Unit 1
- 2117 Wesley Ave
- 2100 Clarence Ave
- 2109 Wesley Ave
- 2107 Wesley Ave
- 2115 Clarence Ave
- 2113 Clarence Ave
- 2117 Clarence Ave