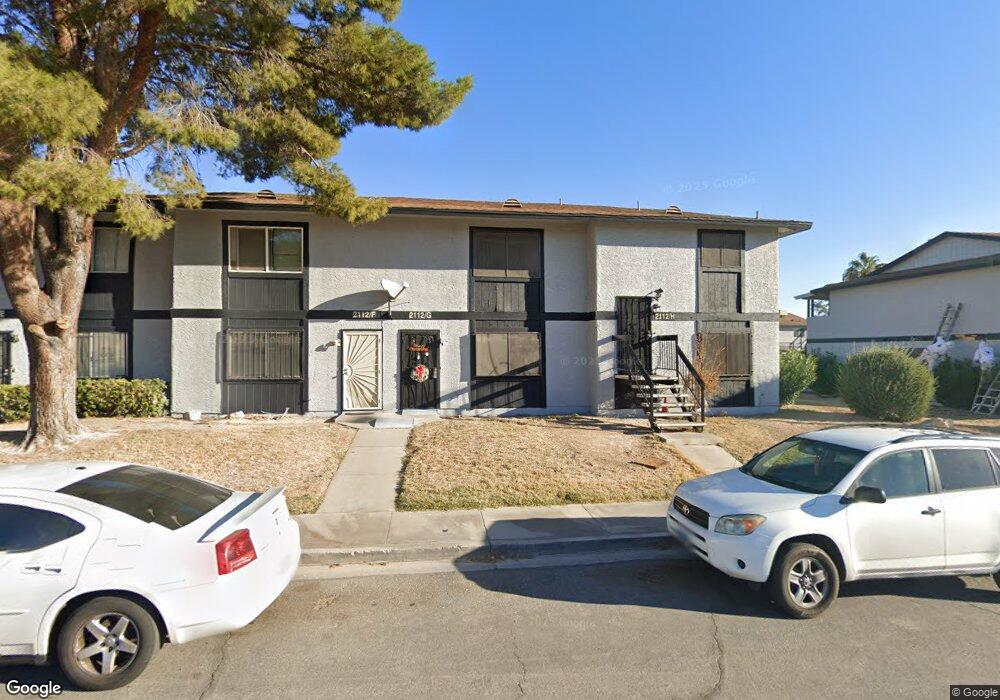
2112 Comet Ave Unit D North Las Vegas, NV 89030
Downtown North Las Vegas NeighborhoodEstimated Value: $144,000 - $178,000
2
Beds
2
Baths
1,080
Sq Ft
$150/Sq Ft
Est. Value
About This Home
This home is located at 2112 Comet Ave Unit D, North Las Vegas, NV 89030 and is currently estimated at $161,970, approximately $149 per square foot. 2112 Comet Ave Unit D is a home located in Clark County with nearby schools including Lois Craig Elementary School, Marvin M Sedway Middle School, and Canyon Springs High School And The Leadership And.
Ownership History
Date
Name
Owned For
Owner Type
Purchase Details
Closed on
Apr 28, 2022
Sold by
Calbert Sr Thomas D
Bought by
Burns Roger L
Current Estimated Value
Home Financials for this Owner
Home Financials are based on the most recent Mortgage that was taken out on this home.
Original Mortgage
$130,000
Outstanding Balance
$122,205
Interest Rate
4.16%
Mortgage Type
New Conventional
Estimated Equity
$39,765
Purchase Details
Closed on
Feb 15, 2016
Sold by
Calbert Thomas
Bought by
Calbert Thomas and Calbert Valerie
Purchase Details
Closed on
Feb 7, 2008
Sold by
Robertson Calbert Clara and Calbert Thomas D
Bought by
Calbert Thomas D
Purchase Details
Closed on
Jan 25, 2002
Sold by
Calbert Thomas D
Bought by
Robertson Calbert Clara A
Home Financials for this Owner
Home Financials are based on the most recent Mortgage that was taken out on this home.
Original Mortgage
$48,000
Interest Rate
7.17%
Create a Home Valuation Report for This Property
The Home Valuation Report is an in-depth analysis detailing your home's value as well as a comparison with similar homes in the area
Home Values in the Area
Average Home Value in this Area
Purchase History
| Date | Buyer | Sale Price | Title Company |
|---|---|---|---|
| Burns Roger L | $145,000 | Stewart Title & Trust Of Tucso | |
| Calbert Thomas | -- | None Available | |
| Calbert Thomas D | -- | None Available | |
| Robertson Calbert Clara A | -- | Fidelity National Title |
Source: Public Records
Mortgage History
| Date | Status | Borrower | Loan Amount |
|---|---|---|---|
| Open | Burns Roger L | $130,000 | |
| Previous Owner | Robertson Calbert Clara A | $48,000 |
Source: Public Records
Tax History Compared to Growth
Tax History
| Year | Tax Paid | Tax Assessment Tax Assessment Total Assessment is a certain percentage of the fair market value that is determined by local assessors to be the total taxable value of land and additions on the property. | Land | Improvement |
|---|---|---|---|---|
| 2025 | $356 | $31,097 | $10,850 | $20,247 |
| 2024 | $346 | $31,097 | $10,850 | $20,247 |
| 2023 | $346 | $31,501 | $12,600 | $18,901 |
| 2022 | $352 | $27,351 | $9,100 | $18,251 |
| 2021 | $327 | $24,039 | $9,100 | $14,939 |
| 2020 | $300 | $23,561 | $7,700 | $15,861 |
| 2019 | $282 | $23,650 | $7,700 | $15,950 |
| 2018 | $269 | $19,616 | $4,200 | $15,416 |
| 2017 | $663 | $19,756 | $4,200 | $15,556 |
| 2016 | $253 | $15,839 | $3,850 | $11,989 |
| 2015 | $251 | $9,548 | $2,800 | $6,748 |
| 2014 | $243 | $6,925 | $1,750 | $5,175 |
Source: Public Records
Map
Nearby Homes
- 2112 Sun Ave Unit J
- 3405 Civic Center Dr Unit E
- 2101 Sun Ave
- 2120 Venus Ave Unit C
- 3417 Civic Center Dr Unit B
- 3505 Mercury St Unit G
- 3420 Mercury St Unit H
- 3420 Mercury St Unit B
- 2313 Seco Adobe Cir
- 3535 Mercury St Unit E
- 2308 Seco Adobe Cir
- 3500 Mercury St Unit F
- 3500 Mercury St Unit A
- 2810 Equador Ct
- 3008 Saint George St Unit F
- 00 Concord
- 2 Reverend Wilson
- 02 Reverend Wilson
- 0 Plymouth Brooks
- 2100 E Piper Ave
- 2112 Comet Ave Unit H
- 2112 Comet Ave Unit F
- 2112 Comet Ave Unit E
- 2112 Comet Ave Unit G
- 2112 Comet Ave Unit C
- 2112 Comet Ave Unit B
- 2112 Comet Ave Unit A
- 2112 Comet Ave
- 2200 Comet Ave Unit E
- 2200 Comet Ave
- 2200 Comet Ave Unit B
- 2200 Comet Ave Unit E
- 2200 Comet Ave Unit A
- 2200 Comet Ave Unit F
- 2200 Comet Ave Unit C
- 2201 Mars Ave Unit C
- 2201 Mars Ave Unit F
- 2201 Mars Ave Unit A
- 2201 Mars Ave Unit D
- 2201 Mars Ave Unit B