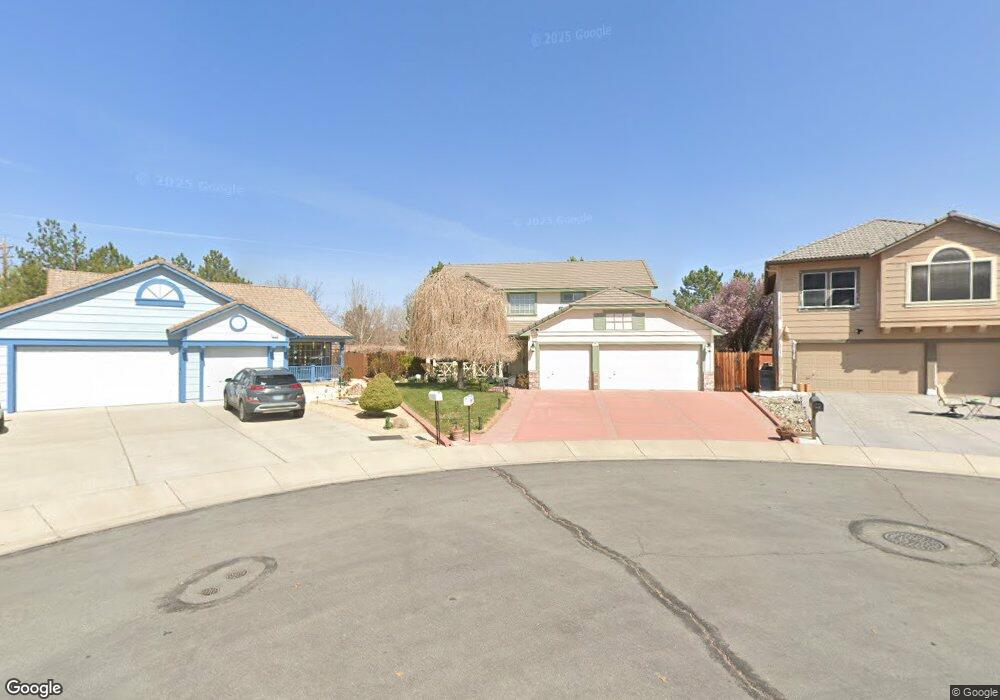
2112 Frisco Way Sparks, NV 89434
D'Andrea NeighborhoodEstimated Value: $601,627 - $733,000
4
Beds
3
Baths
2,306
Sq Ft
$283/Sq Ft
Est. Value
About This Home
This home is located at 2112 Frisco Way, Sparks, NV 89434 and is currently estimated at $653,157, approximately $283 per square foot. 2112 Frisco Way is a home located in Washoe County with nearby schools including Marvin Moss Elementary School, Lou Mendive Middle School, and Edward C Reed High School.
Ownership History
Date
Name
Owned For
Owner Type
Purchase Details
Closed on
Jul 12, 2012
Sold by
Huseboe Susan E
Bought by
Huseboe Susan E
Current Estimated Value
Purchase Details
Closed on
Oct 10, 2003
Sold by
Huseboe Susan E
Bought by
Huseboe Susan E and Susan Elaine Huseboe Revocable Trust
Purchase Details
Closed on
Feb 3, 1999
Sold by
Schauf Kirk M
Bought by
Huseboe Susan E
Purchase Details
Closed on
Jan 3, 1994
Sold by
Lewis Homes Of Nevada
Bought by
Schauf Kirk M and Huseboe Susan E
Home Financials for this Owner
Home Financials are based on the most recent Mortgage that was taken out on this home.
Original Mortgage
$165,600
Interest Rate
7.16%
Create a Home Valuation Report for This Property
The Home Valuation Report is an in-depth analysis detailing your home's value as well as a comparison with similar homes in the area
Home Values in the Area
Average Home Value in this Area
Purchase History
| Date | Buyer | Sale Price | Title Company |
|---|---|---|---|
| Huseboe Susan E | -- | None Available | |
| Huseboe Susan E | -- | -- | |
| Huseboe Susan E | -- | Stewart Title Company | |
| Schauf Kirk M | $174,500 | Stewart Title |
Source: Public Records
Mortgage History
| Date | Status | Borrower | Loan Amount |
|---|---|---|---|
| Previous Owner | Schauf Kirk M | $165,600 |
Source: Public Records
Tax History Compared to Growth
Tax History
| Year | Tax Paid | Tax Assessment Tax Assessment Total Assessment is a certain percentage of the fair market value that is determined by local assessors to be the total taxable value of land and additions on the property. | Land | Improvement |
|---|---|---|---|---|
| 2026 | $2,024 | $117,800 | $45,045 | $72,755 |
| 2025 | $2,630 | $116,853 | $42,560 | $74,293 |
| 2024 | $2,553 | $112,607 | $36,995 | $75,612 |
| 2023 | $2,553 | $113,237 | $41,370 | $71,867 |
| 2022 | $2,479 | $92,093 | $31,955 | $60,138 |
| 2021 | $2,407 | $87,529 | $27,405 | $60,124 |
| 2020 | $2,334 | $86,246 | $25,725 | $60,521 |
| 2019 | $2,266 | $81,302 | $23,030 | $58,272 |
| 2018 | $2,201 | $74,139 | $18,620 | $55,519 |
| 2017 | $2,082 | $72,554 | $18,585 | $53,969 |
| 2016 | $2,029 | $70,972 | $15,820 | $55,152 |
| 2015 | $2,026 | $69,045 | $13,755 | $55,290 |
| 2014 | $1,967 | $65,307 | $12,005 | $53,302 |
| 2013 | -- | $56,996 | $9,695 | $47,301 |
Source: Public Records
Map
Nearby Homes
- 2002 Wabash Cir
- 1005 Amico Dr
- 2119 Avella Dr
- 2159 Meritage Dr
- 1866 Pocono Ct
- 1960 Vicenza Dr
- 1770 Burnside Dr
- 2688 Laguna Way
- 2600 Anqua Ct
- 2552 Cosimo Ct
- 2535 Tuscan Way
- 2252 Sycamore Glen Dr
- 1675 Round Mountain Cir
- 1688 Round Mountain Cir
- 1332 Coachman Ct
- 2524 Garzoni Dr
- 1990 Fargo Way
- 1290 Highgate Ct
- 1280 O'Callaghan Dr
- 2407 Sunny Slope Dr Unit 1
- 2106 Frisco Way
- 2102 Frisco Way
- 2122 Frisco Way
- 2005 Calabria Dr
- 2130 Frisco Way
- 2015 Calabria Dr
- 1094 Ricco Dr
- 1095 Ricco Dr
- 2140 Frisco Way
- 1095 Country Ridge Dr
- 1994 Frisco Ct
- 1990 Frisco Ct
- 2035 Calabria Dr Unit 5
- 1986 Frisco Ct
- 1087 Ricco Dr
- 1086 Ricco Dr
- 1982 Frisco Ct
- 2150 Frisco Way
- 1381 Palermo Dr
- 2045 Calabria Dr