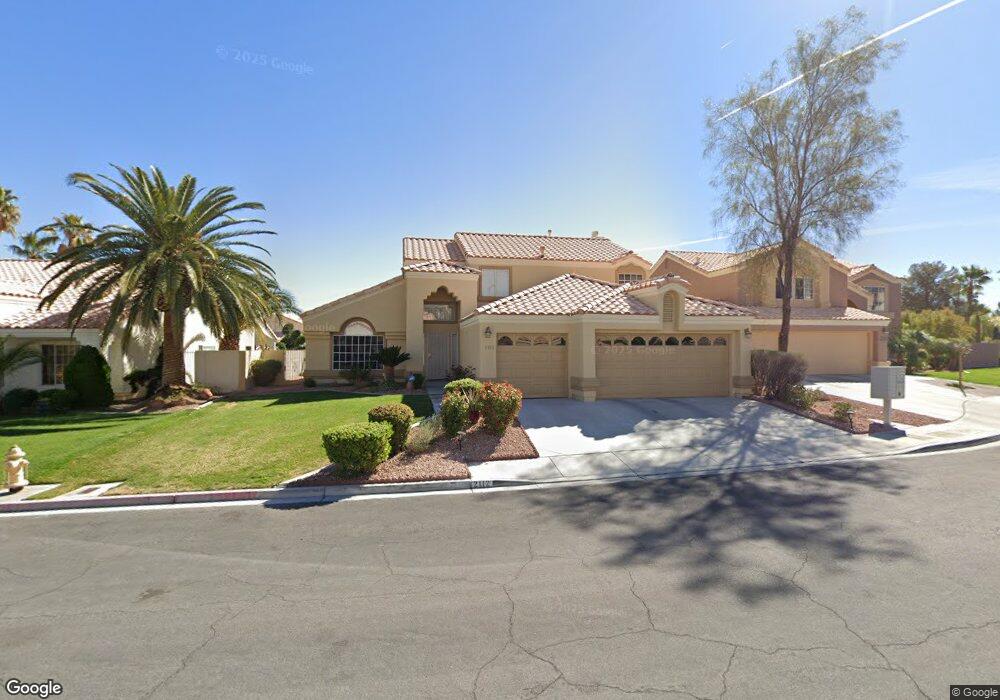
2112 Greenhouse Ct Las Vegas, NV 89134
Summerlin NeighborhoodEstimated Value: $634,000 - $745,000
3
Beds
3
Baths
2,444
Sq Ft
$281/Sq Ft
Est. Value
About This Home
This home is located at 2112 Greenhouse Ct, Las Vegas, NV 89134 and is currently estimated at $686,192, approximately $280 per square foot. 2112 Greenhouse Ct is a home located in Clark County with nearby schools including William Lummis Elementary School, Ernest Becker Middle School, and Palo Verde High School.
Ownership History
Date
Name
Owned For
Owner Type
Purchase Details
Closed on
Mar 22, 2004
Sold by
Morris James and Morris Bettie Jean
Bought by
Morris James and Morris Bettie Jean
Current Estimated Value
Purchase Details
Closed on
Jan 14, 2004
Sold by
Byron James and Morris Bettie Jean
Bought by
Morris James B and Morris Bettie J
Home Financials for this Owner
Home Financials are based on the most recent Mortgage that was taken out on this home.
Original Mortgage
$201,600
Outstanding Balance
$95,065
Interest Rate
6.02%
Mortgage Type
New Conventional
Estimated Equity
$591,127
Purchase Details
Closed on
Aug 9, 2001
Sold by
Byron James and Morris Bettie Jean
Bought by
Byron James and Morris Bettie Jean
Purchase Details
Closed on
Feb 27, 1995
Sold by
Lee Lance Christopher and Lee Vicki Nancy
Bought by
Morris James B and Morris Bettie J
Home Financials for this Owner
Home Financials are based on the most recent Mortgage that was taken out on this home.
Original Mortgage
$158,400
Interest Rate
8.86%
Create a Home Valuation Report for This Property
The Home Valuation Report is an in-depth analysis detailing your home's value as well as a comparison with similar homes in the area
Home Values in the Area
Average Home Value in this Area
Purchase History
| Date | Buyer | Sale Price | Title Company |
|---|---|---|---|
| Morris James | -- | -- | |
| Morris James B | -- | Old Republic Title Co Of Ne | |
| Byron James | -- | -- | |
| Morris James B | $198,000 | Old Republic Title Company |
Source: Public Records
Mortgage History
| Date | Status | Borrower | Loan Amount |
|---|---|---|---|
| Open | Morris James B | $201,600 | |
| Closed | Morris James B | $158,400 |
Source: Public Records
Tax History Compared to Growth
Tax History
| Year | Tax Paid | Tax Assessment Tax Assessment Total Assessment is a certain percentage of the fair market value that is determined by local assessors to be the total taxable value of land and additions on the property. | Land | Improvement |
|---|---|---|---|---|
| 2025 | $2,960 | $133,934 | $60,200 | $73,734 |
| 2024 | $2,783 | $133,934 | $60,200 | $73,734 |
| 2023 | $2,783 | $116,413 | $45,850 | $70,563 |
| 2022 | $2,690 | $110,684 | $45,850 | $64,834 |
| 2021 | $2,614 | $103,543 | $41,650 | $61,893 |
| 2020 | $2,533 | $99,130 | $37,450 | $61,680 |
| 2019 | $2,459 | $96,761 | $35,700 | $61,061 |
| 2018 | $2,388 | $93,069 | $34,300 | $58,769 |
| 2017 | $3,001 | $94,012 | $34,300 | $59,712 |
| 2016 | $2,260 | $83,337 | $23,450 | $59,887 |
| 2015 | $2,257 | $80,976 | $21,700 | $59,276 |
| 2014 | $2,190 | $67,041 | $14,875 | $52,166 |
Source: Public Records
Map
Nearby Homes
- 9232 Jadecrest Dr
- 9260 Spruce Mountain Way
- 2269 Pine Forest Ct
- 9248 Evergreen Canyon Dr
- 9220 Evergreen Canyon Dr
- 9401 Summer Rain Dr
- 9233 Magic Flower Ave
- 9137 Cotton Rose Way
- 2113 Desert Peak Rd
- 9412 Meadow Ridge Ln
- 9416 Rolling Ridge Ln
- 9409 Hershey Ln
- 9441 Amber Valley Ln
- 9449 Amber Valley Ln
- 9017 Cotton Rose Way
- 2245 Juniper Berry Dr
- 9004 Rolling Knoll Ct
- 9500 Sierra Summit Ave
- 9440 Grenville Ave
- 9413 Cedar Heights Ave Unit 2
- 2116 Greenhouse Ct
- 2108 Greenhouse Ct
- 2113 Crestpoint Way
- 2117 Crestpoint Way
- 2120 Greenhouse Ct
- 2113 Greenhouse Ct
- 2109 Crestpoint Way
- 2121 Crestpoint Way
- 2109 Greenhouse Ct
- 2117 Greenhouse Ct
- 2100 Greenhouse Ct
- 2121 Greenhouse Ct
- 2105 Greenhouse Ct
- 2105 Crestpoint Way
- 2101 Greenhouse Ct
- 2112 Crestpoint Way
- 2116 Crooked Pine Dr
- 2112 Crooked Pine Dr
- 2108 Crestpoint Way
- 2120 Crooked Pine Dr