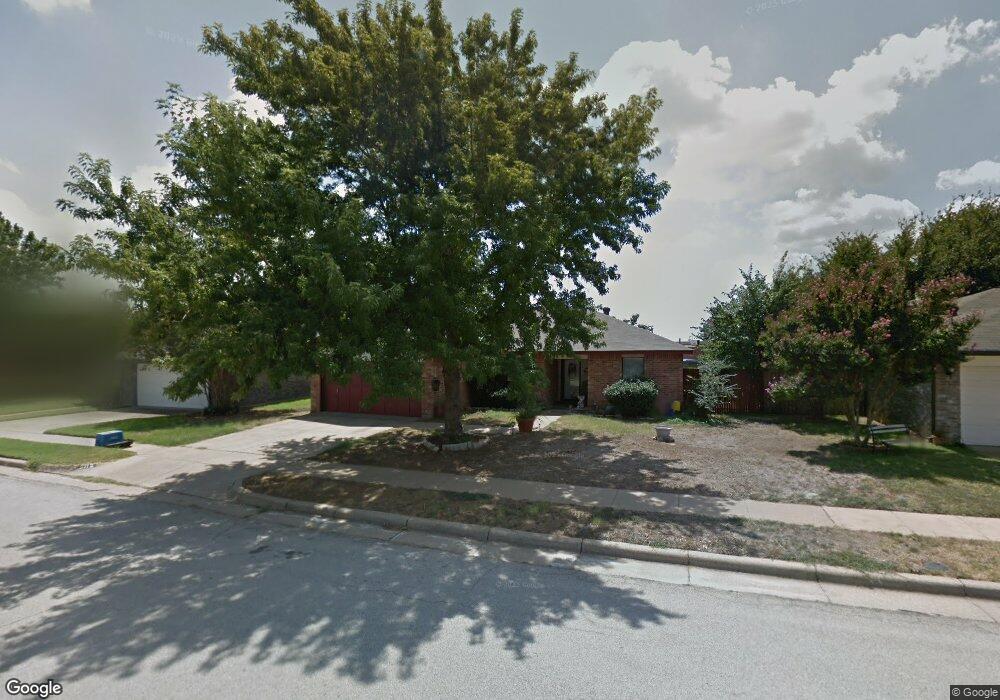
2112 Homecraft Dr Bedford, TX 76021
Estimated Value: $352,049 - $395,000
4
Beds
2
Baths
1,598
Sq Ft
$235/Sq Ft
Est. Value
About This Home
This home is located at 2112 Homecraft Dr, Bedford, TX 76021 and is currently estimated at $375,762, approximately $235 per square foot. 2112 Homecraft Dr is a home located in Tarrant County with nearby schools including Spring Garden Elementary School, Harwood Junior High School, and Trinity High School.
Ownership History
Date
Name
Owned For
Owner Type
Purchase Details
Closed on
Oct 17, 2003
Sold by
English Lezlie D
Bought by
Reymundo Pilar
Current Estimated Value
Home Financials for this Owner
Home Financials are based on the most recent Mortgage that was taken out on this home.
Original Mortgage
$121,099
Interest Rate
6.1%
Mortgage Type
FHA
Purchase Details
Closed on
Aug 13, 1998
Sold by
Jasper David V and Jasper Kerry D
Bought by
English Lezlie D
Home Financials for this Owner
Home Financials are based on the most recent Mortgage that was taken out on this home.
Original Mortgage
$75,200
Interest Rate
6.9%
Purchase Details
Closed on
Oct 24, 1995
Sold by
Hwang S S
Bought by
Jasper David and Jasper Kerry D
Home Financials for this Owner
Home Financials are based on the most recent Mortgage that was taken out on this home.
Original Mortgage
$86,299
Interest Rate
7.6%
Mortgage Type
FHA
Create a Home Valuation Report for This Property
The Home Valuation Report is an in-depth analysis detailing your home's value as well as a comparison with similar homes in the area
Home Values in the Area
Average Home Value in this Area
Purchase History
| Date | Buyer | Sale Price | Title Company |
|---|---|---|---|
| Reymundo Pilar | -- | -- | |
| English Lezlie D | -- | First American Title Co | |
| Jasper David | -- | Stewart Title |
Source: Public Records
Mortgage History
| Date | Status | Borrower | Loan Amount |
|---|---|---|---|
| Closed | Reymundo Pilar | $121,099 | |
| Previous Owner | English Lezlie D | $75,200 | |
| Previous Owner | Jasper David | $86,299 |
Source: Public Records
Tax History Compared to Growth
Tax History
| Year | Tax Paid | Tax Assessment Tax Assessment Total Assessment is a certain percentage of the fair market value that is determined by local assessors to be the total taxable value of land and additions on the property. | Land | Improvement |
|---|---|---|---|---|
| 2025 | $1,041 | $337,854 | $75,000 | $262,854 |
| 2024 | $1,041 | $337,854 | $75,000 | $262,854 |
| 2023 | $5,443 | $310,026 | $45,000 | $265,026 |
| 2022 | $5,635 | $257,987 | $45,000 | $212,987 |
| 2021 | $5,671 | $245,004 | $45,000 | $200,004 |
| 2020 | $5,204 | $229,665 | $45,000 | $184,665 |
| 2019 | $4,834 | $231,143 | $45,000 | $186,143 |
| 2018 | $2,091 | $180,883 | $45,000 | $135,883 |
| 2017 | $3,978 | $196,799 | $18,000 | $178,799 |
| 2016 | $3,616 | $183,063 | $18,000 | $165,063 |
| 2015 | $2,126 | $135,900 | $18,000 | $117,900 |
| 2014 | $2,126 | $135,900 | $18,000 | $117,900 |
Source: Public Records
Map
Nearby Homes
- 2220 Tiffany Glenn Ct
- 2909 Oakridge Dr
- 3532 Meadowside Dr
- 3152 Woodbridge Dr
- 22 Lincolnshire Cir
- 3513 Meadowside Dr
- 2922 Beachtree Ln
- 1723 Post Oak Dr
- 2109 Oakmeadow St
- 2112 Oakmeadow Place
- 2209 Laurel Ct
- 2600 Willow Bend
- 2521 Sanders Ct
- 1630 Post Oak Dr
- 1704 Indian Oaks Ct
- 3024 Highgate Ln
- 1800 Hampton Dr
- 1636 Bedford Oaks Dr
- 2616 Greenwood Ct
- 2024 Oakmeadow St
- 2108 Homecraft Dr
- 2116 Homecraft Dr
- 2104 Homecraft Dr
- 2120 Homecraft Dr
- 2113 Homecraft Dr
- 3001 Homecraft Ct
- 2119 Homecraft Dr
- 2100 Homecraft Dr
- 3005 Homecraft Ct
- 3004 Homecraft Ct
- 2101 Homecraft Dr
- 2012 Homecraft Dr
- 2200 Homecraft Ln
- 2201 Hollybush Ln
- 3008 Homecraft Ct
- 3009 Homecraft Ct
- 3000 Richwood Cir
- 2201 Homecraft Ln
- 3004 Richwood Cir
- 2204 Homecraft Ln