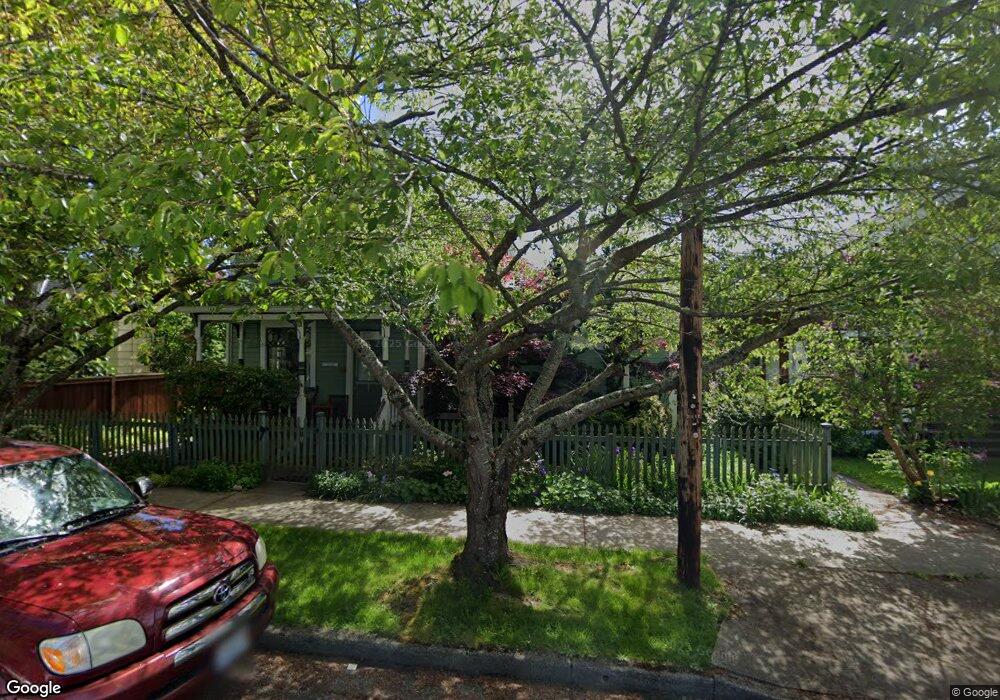
2112 J St Bellingham, WA 98225
Lettered Streets NeighborhoodEstimated Value: $734,048 - $894,000
3
Beds
2
Baths
1,676
Sq Ft
$480/Sq Ft
Est. Value
About This Home
This home is located at 2112 J St, Bellingham, WA 98225 and is currently estimated at $803,762, approximately $479 per square foot. 2112 J St is a home located in Whatcom County with nearby schools including Parkview Elementary School, Whatcom Middle School, and Bellingham High School.
Ownership History
Date
Name
Owned For
Owner Type
Purchase Details
Closed on
Dec 12, 2005
Sold by
Donovan Jame and Donovan Stephanie
Bought by
Curley Clyde W and Curley Susan A
Current Estimated Value
Home Financials for this Owner
Home Financials are based on the most recent Mortgage that was taken out on this home.
Original Mortgage
$239,900
Outstanding Balance
$134,385
Interest Rate
6.31%
Mortgage Type
Fannie Mae Freddie Mac
Estimated Equity
$669,377
Purchase Details
Closed on
May 21, 2002
Sold by
Murphy Seth T and Elise Murphy J
Bought by
Donovan Jame and Donovan Stephanie
Purchase Details
Closed on
Jan 26, 2001
Sold by
Powell Timothy D and Powell Sandra L
Bought by
Murphy Seth T and Elise Murphy J
Home Financials for this Owner
Home Financials are based on the most recent Mortgage that was taken out on this home.
Original Mortgage
$132,000
Interest Rate
7.41%
Create a Home Valuation Report for This Property
The Home Valuation Report is an in-depth analysis detailing your home's value as well as a comparison with similar homes in the area
Home Values in the Area
Average Home Value in this Area
Purchase History
| Date | Buyer | Sale Price | Title Company |
|---|---|---|---|
| Curley Clyde W | $340,180 | Stewart Title Company | |
| Donovan Jame | -- | Stewart Title Company | |
| Murphy Seth T | $165,000 | Charter Title Corporation |
Source: Public Records
Mortgage History
| Date | Status | Borrower | Loan Amount |
|---|---|---|---|
| Open | Curley Clyde W | $239,900 | |
| Previous Owner | Murphy Seth T | $132,000 | |
| Closed | Murphy Seth T | $24,750 |
Source: Public Records
Tax History Compared to Growth
Tax History
| Year | Tax Paid | Tax Assessment Tax Assessment Total Assessment is a certain percentage of the fair market value that is determined by local assessors to be the total taxable value of land and additions on the property. | Land | Improvement |
|---|---|---|---|---|
| 2024 | $5,171 | $648,017 | $246,304 | $401,713 |
| 2023 | $5,171 | $664,476 | $252,560 | $411,916 |
| 2022 | $4,223 | $572,834 | $217,728 | $355,106 |
| 2021 | $4,143 | $454,630 | $172,800 | $281,830 |
| 2020 | $4,236 | $420,954 | $160,000 | $260,954 |
| 2019 | $3,792 | $416,003 | $141,415 | $274,588 |
| 2018 | $3,819 | $373,415 | $126,965 | $246,450 |
| 2017 | $3,295 | $321,499 | $109,310 | $212,189 |
| 2016 | $2,883 | $289,921 | $98,090 | $191,831 |
| 2015 | $2,827 | $264,042 | $89,590 | $174,452 |
| 2014 | -- | $250,514 | $85,000 | $165,514 |
| 2013 | -- | $242,530 | $73,500 | $169,030 |
Source: Public Records
Map
Nearby Homes
- 2500 Meridian St
- 1800 J St
- 2600 Elm St
- 1410 J St
- 1315 Astor St
- 1200 W Holly St
- 2500 Cornwall Ave
- 2019 Cornwall Ave
- 2805 Walnut St
- 3008 Meridian St
- 2111 Franklin St
- 3018 Elm St
- 2218 Jaeger St
- 2432 Grant St
- 1025 Granary Ave Unit 503
- 1025 Granary Ave Unit 404
- 1025 Granary Ave Unit 306
- 1025 Granary Ave Unit 506
- 1025 Granary Ave Unit 501-A
- 1025 Granary Ave Unit 307-B