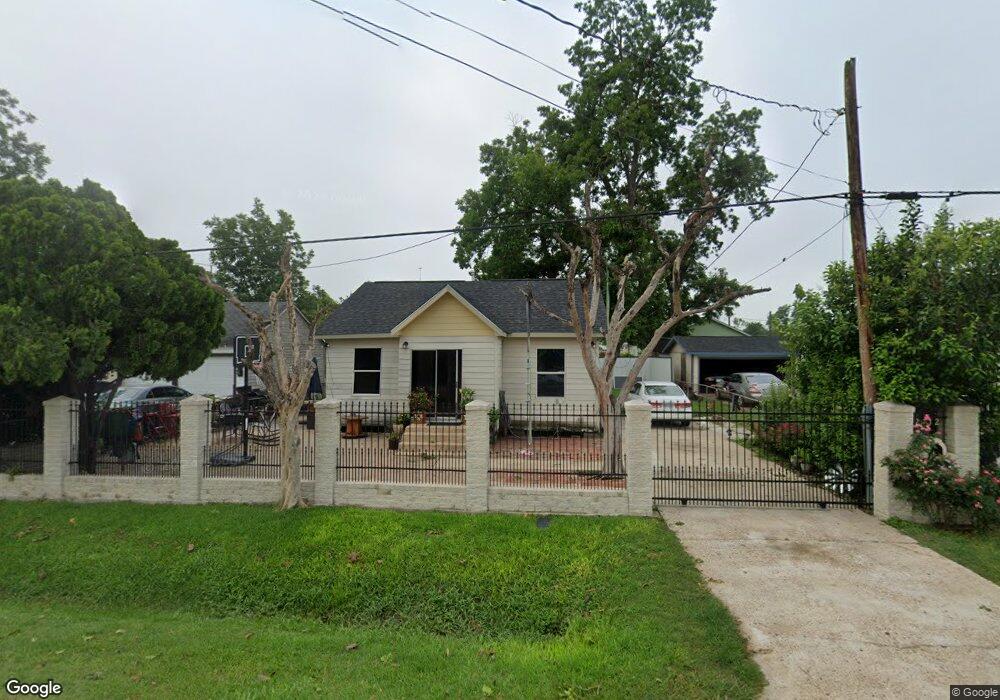
2112 Reid St Houston, TX 77026
Eastex-Jensen NeighborhoodEstimated Value: $154,549 - $200,000
3
Beds
1
Bath
1,044
Sq Ft
$174/Sq Ft
Est. Value
About This Home
This home is located at 2112 Reid St, Houston, TX 77026 and is currently estimated at $181,137, approximately $173 per square foot. 2112 Reid St is a home located in Harris County with nearby schools including Ross Elementary School, Key Middle, and Northside High School.
Ownership History
Date
Name
Owned For
Owner Type
Purchase Details
Closed on
Oct 18, 2008
Sold by
Dela Fuente Augustin and De La Fuente Norma
Bought by
Deleon Jose Manuel
Current Estimated Value
Purchase Details
Closed on
Dec 9, 2002
Sold by
Robert Jack Golden Inc
Bought by
Delafuente Augustin and Delafuente Norma
Home Financials for this Owner
Home Financials are based on the most recent Mortgage that was taken out on this home.
Original Mortgage
$7,893
Interest Rate
6.05%
Mortgage Type
Seller Take Back
Create a Home Valuation Report for This Property
The Home Valuation Report is an in-depth analysis detailing your home's value as well as a comparison with similar homes in the area
Home Values in the Area
Average Home Value in this Area
Purchase History
| Date | Buyer | Sale Price | Title Company |
|---|---|---|---|
| Deleon Jose Manuel | -- | None Available | |
| Delafuente Augustin | -- | -- |
Source: Public Records
Mortgage History
| Date | Status | Borrower | Loan Amount |
|---|---|---|---|
| Previous Owner | Delafuente Augustin | $7,893 |
Source: Public Records
Tax History Compared to Growth
Tax History
| Year | Tax Paid | Tax Assessment Tax Assessment Total Assessment is a certain percentage of the fair market value that is determined by local assessors to be the total taxable value of land and additions on the property. | Land | Improvement |
|---|---|---|---|---|
| 2025 | $665 | $121,142 | $60,116 | $61,026 |
| 2024 | $665 | $130,023 | $65,981 | $64,042 |
| 2023 | $665 | $127,507 | $65,981 | $61,526 |
| 2022 | $1,233 | $101,858 | $43,988 | $57,870 |
| 2021 | $1,186 | $82,363 | $43,988 | $38,375 |
| 2020 | $1,120 | $63,527 | $23,460 | $40,067 |
| 2019 | $1,064 | $64,615 | $23,460 | $41,155 |
| 2018 | $475 | $38,236 | $13,196 | $25,040 |
| 2017 | $967 | $38,236 | $13,196 | $25,040 |
| 2016 | $967 | $38,236 | $13,196 | $25,040 |
| 2015 | $572 | $36,438 | $11,730 | $24,708 |
| 2014 | $572 | $36,438 | $11,730 | $24,708 |
Source: Public Records
Map
Nearby Homes