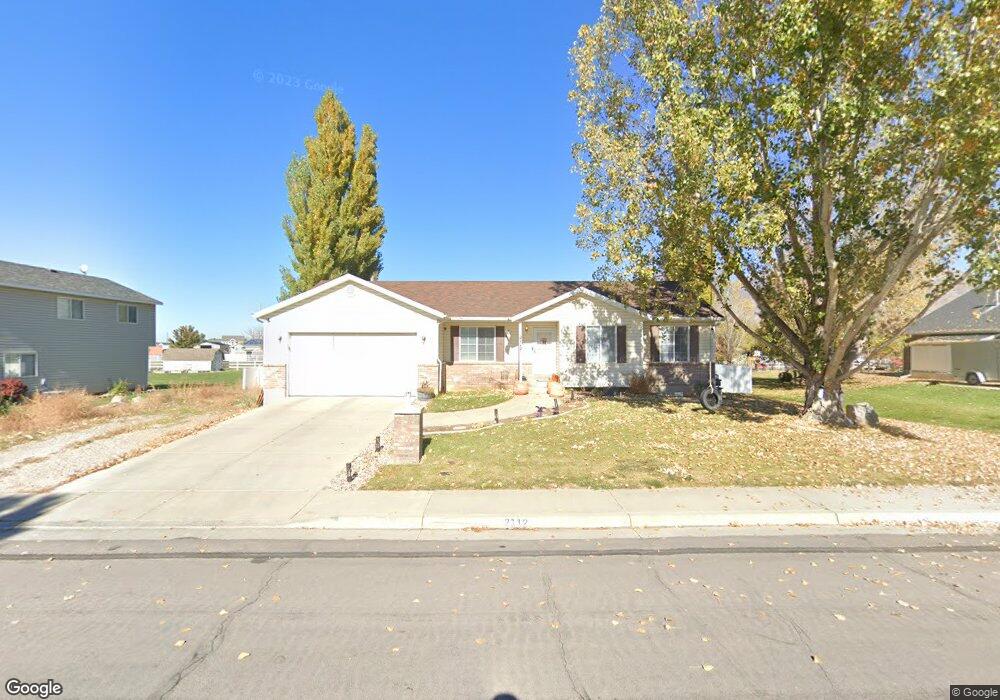
2112 W 325 S Mapleton, UT 84664
Estimated Value: $634,000 - $729,000
3
Beds
2
Baths
3,030
Sq Ft
$225/Sq Ft
Est. Value
About This Home
This home is located at 2112 W 325 S, Mapleton, UT 84664 and is currently estimated at $682,430, approximately $225 per square foot. 2112 W 325 S is a home located in Utah County with nearby schools including Maple Ridge Elementary, Mapleton Junior High School, and Maple Mountain High School.
Ownership History
Date
Name
Owned For
Owner Type
Purchase Details
Closed on
Oct 25, 2024
Sold by
Robison Shaun P and Robison Hayley
Bought by
Shaun And Hayley Robison Family Trust and Robison
Current Estimated Value
Purchase Details
Closed on
Oct 6, 2021
Sold by
Buck Gary
Bought by
Robinson Shaun P and Robison Hayley
Home Financials for this Owner
Home Financials are based on the most recent Mortgage that was taken out on this home.
Original Mortgage
$524,361
Interest Rate
2.8%
Mortgage Type
VA
Purchase Details
Closed on
Jan 15, 2008
Sold by
Street Dale J
Bought by
Buck Gary and Buck Janis
Purchase Details
Closed on
Jul 22, 2004
Sold by
Manwaring Bruce A and Manwaring Kaylene L
Bought by
Street Dale J
Purchase Details
Closed on
Dec 1, 2000
Sold by
Salisbury Development Lc
Bought by
Manwaring Bruce A and Manwaring Kaylene L
Home Financials for this Owner
Home Financials are based on the most recent Mortgage that was taken out on this home.
Original Mortgage
$132,000
Interest Rate
7.86%
Create a Home Valuation Report for This Property
The Home Valuation Report is an in-depth analysis detailing your home's value as well as a comparison with similar homes in the area
Home Values in the Area
Average Home Value in this Area
Purchase History
| Date | Buyer | Sale Price | Title Company |
|---|---|---|---|
| Shaun And Hayley Robison Family Trust | -- | None Listed On Document | |
| Robinson Shaun P | -- | Vanguard Title Ins Agcy Llc | |
| Buck Gary | -- | First American Spanish Fo | |
| Street Dale J | -- | Surety Title | |
| Manwaring Bruce A | -- | Provo Land Title Company |
Source: Public Records
Mortgage History
| Date | Status | Borrower | Loan Amount |
|---|---|---|---|
| Previous Owner | Robinson Shaun P | $524,361 | |
| Previous Owner | Manwaring Bruce A | $132,000 |
Source: Public Records
Tax History
| Year | Tax Paid | Tax Assessment Tax Assessment Total Assessment is a certain percentage of the fair market value that is determined by local assessors to be the total taxable value of land and additions on the property. | Land | Improvement |
|---|---|---|---|---|
| 2025 | $2,921 | $321,365 | -- | -- |
| 2024 | $2,921 | $286,110 | $0 | $0 |
| 2023 | $3,003 | $296,010 | $0 | $0 |
| 2022 | $3,472 | $338,470 | $0 | $0 |
| 2021 | $2,921 | $437,100 | $157,400 | $279,700 |
| 2020 | $2,894 | $419,000 | $139,300 | $279,700 |
| 2019 | $2,686 | $396,900 | $134,600 | $262,300 |
| 2018 | $2,453 | $345,100 | $114,800 | $230,300 |
| 2017 | $2,193 | $163,735 | $0 | $0 |
| 2016 | $2,159 | $160,215 | $0 | $0 |
| 2015 | $2,113 | $155,870 | $0 | $0 |
| 2014 | $2,033 | $147,235 | $0 | $0 |
Source: Public Records
Map
Nearby Homes
- 1810 W 300 S Unit D
- 2216 W Silver Leaf Dr Unit 35
- 442 S Doubleday St
- 1656 W 300 S Unit B
- 1655 W 200 S Unit A
- 2652 W Maple St Unit 281
- 1780 W Maple St
- 203 N 1900 W
- 141 N Pinnacle Ave
- 2559 W Aurora Ave Unit 292
- 2414 W Santa fe Dr
- 281 N Pheasant Dr
- 2458 W Aurora Ave Unit 287
- 293 N Pheasant Dr
- 76-307 S Crimson Way
- 216 N 1750 W
- 18 S Crimson Way Unit 304
- 21 S Crimson Way Unit 310
- 906 S Crescent Way
- 715 W 4600 S Unit Lot I303
Your Personal Tour Guide
Ask me questions while you tour the home.