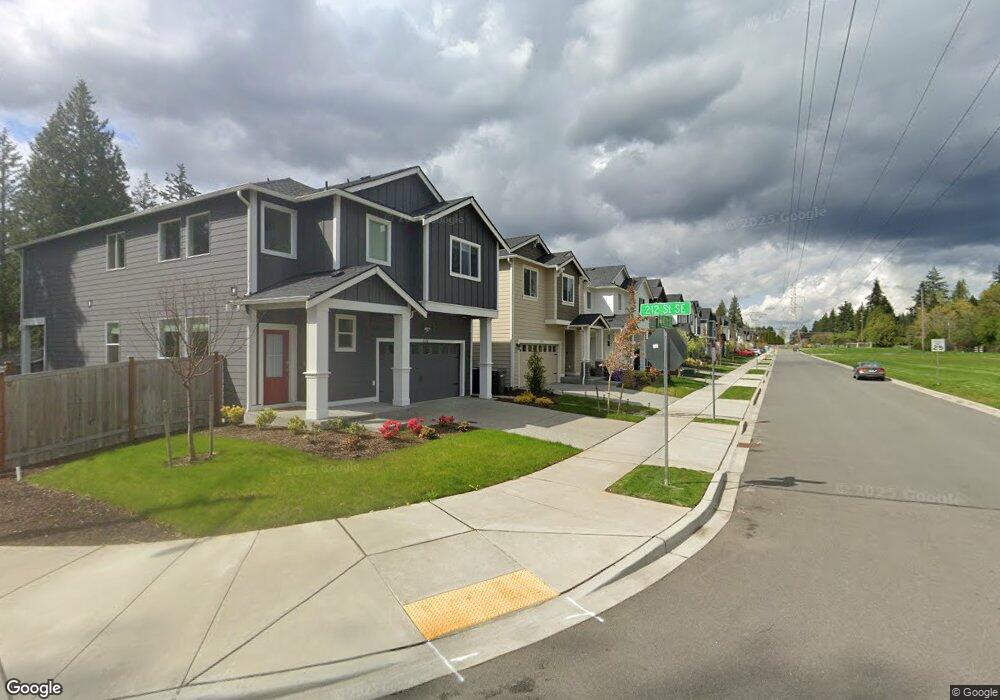
21124 42nd Dr SE Unit 2682865-15730 Bothell, WA 98021
Canyon Creek NeighborhoodEstimated Value: $1,017,000 - $1,320,000
3
Beds
3
Baths
1,524
Sq Ft
$732/Sq Ft
Est. Value
About This Home
This home is located at 21124 42nd Dr SE Unit 2682865-15730, Bothell, WA 98021 and is currently estimated at $1,115,883, approximately $732 per square foot. 21124 42nd Dr SE Unit 2682865-15730 is a home located in Snohomish County with nearby schools including Ruby Bridges Elementary School, Skyview Middle School, and North Creek High School.
Ownership History
Date
Name
Owned For
Owner Type
Purchase Details
Closed on
Jun 20, 2017
Sold by
Scroggs Robert J and Scroggs Kristi J
Bought by
Baker James M and Baker Valerie Anne
Current Estimated Value
Home Financials for this Owner
Home Financials are based on the most recent Mortgage that was taken out on this home.
Original Mortgage
$601,851
Outstanding Balance
$496,869
Interest Rate
3.75%
Mortgage Type
FHA
Estimated Equity
$619,014
Purchase Details
Closed on
Feb 17, 2005
Sold by
Scroggs Jay and Scroggs Tammy J
Bought by
Scroggs Robert J and Scroggs Kristi J
Home Financials for this Owner
Home Financials are based on the most recent Mortgage that was taken out on this home.
Original Mortgage
$309,600
Interest Rate
5.12%
Mortgage Type
Purchase Money Mortgage
Purchase Details
Closed on
Nov 1, 2001
Sold by
Alvarez Alfonzo A and Alvarez Debbie
Bought by
Scroggs Jay and Scroggs Tammy
Create a Home Valuation Report for This Property
The Home Valuation Report is an in-depth analysis detailing your home's value as well as a comparison with similar homes in the area
Home Values in the Area
Average Home Value in this Area
Purchase History
| Date | Buyer | Sale Price | Title Company |
|---|---|---|---|
| Baker James M | $613,000 | Chicago Title Company | |
| Scroggs Robert J | $387,500 | Ticor Title | |
| Scroggs Jay | $180,000 | Stewart Title |
Source: Public Records
Mortgage History
| Date | Status | Borrower | Loan Amount |
|---|---|---|---|
| Open | Baker James M | $601,851 | |
| Previous Owner | Scroggs Robert J | $309,600 |
Source: Public Records
Tax History Compared to Growth
Tax History
| Year | Tax Paid | Tax Assessment Tax Assessment Total Assessment is a certain percentage of the fair market value that is determined by local assessors to be the total taxable value of land and additions on the property. | Land | Improvement |
|---|---|---|---|---|
| 2025 | $7,923 | $945,100 | $617,500 | $327,600 |
| 2024 | $7,923 | $882,500 | $555,800 | $326,700 |
| 2023 | $7,736 | $960,200 | $631,800 | $328,400 |
| 2022 | $6,744 | $664,800 | $389,500 | $275,300 |
| 2020 | $6,757 | $629,500 | $391,500 | $238,000 |
| 2019 | $5,968 | $561,900 | $325,500 | $236,400 |
| 2018 | $5,156 | $451,000 | $274,400 | $176,600 |
| 2017 | $4,410 | $391,900 | $213,900 | $178,000 |
| 2016 | $4,232 | $366,900 | $195,300 | $171,600 |
| 2015 | $4,106 | $338,000 | $180,000 | $158,000 |
| 2013 | $3,577 | $261,400 | $133,200 | $128,200 |
Source: Public Records
Map
Nearby Homes
- 21407 39th Dr SE Unit A
- 3928 214th Place SE Unit A
- 3928 214th Place SE Unit B
- 3926 214th Place SE Unit B
- 4001 215th St SE Unit A
- 3918 214th Place SE Unit A
- 20615 39th Ave SE
- 4403 216th Place SE
- 3631 214th Place SE
- 4426 216th Place SE
- 21713 38th Dr SE
- 21903 41st Ave SE
- 4223 220th St SE
- 4219 220th St SE
- 4119 220th St SE
- 4103 220th St SE
- 4126 220th St SE
- 4118 220th St SE
- 4132 220th St SE
- 3721 219th Place SE Unit 41
- 21124 42nd Dr SE Unit 123
- 4123 212th St SE
- 4117 212th St SE
- 21117 42nd Ave SE Unit 121
- 4205 212th St SE
- 4114 212th St SE
- 4105 212th St SE
- 21113 42nd Ave SE Unit 120
- 21207 41st Ave SE Unit 34
- 21104 42nd Ave SE Unit 146
- 21104 42nd Ave SE
- 4103 212th St SE
- 21203 41st Ave SE Unit 14
- 21203 41st Ave SE Unit 33
- 21109 42nd Ave SE Unit 119
- 21211 41st Ave SE Unit 35
- 21204 41st Ave SE Unit 32
- 21205 42nd Ave SE
- 4217 212th St SE
- 21206 41st Ave SE Unit 31