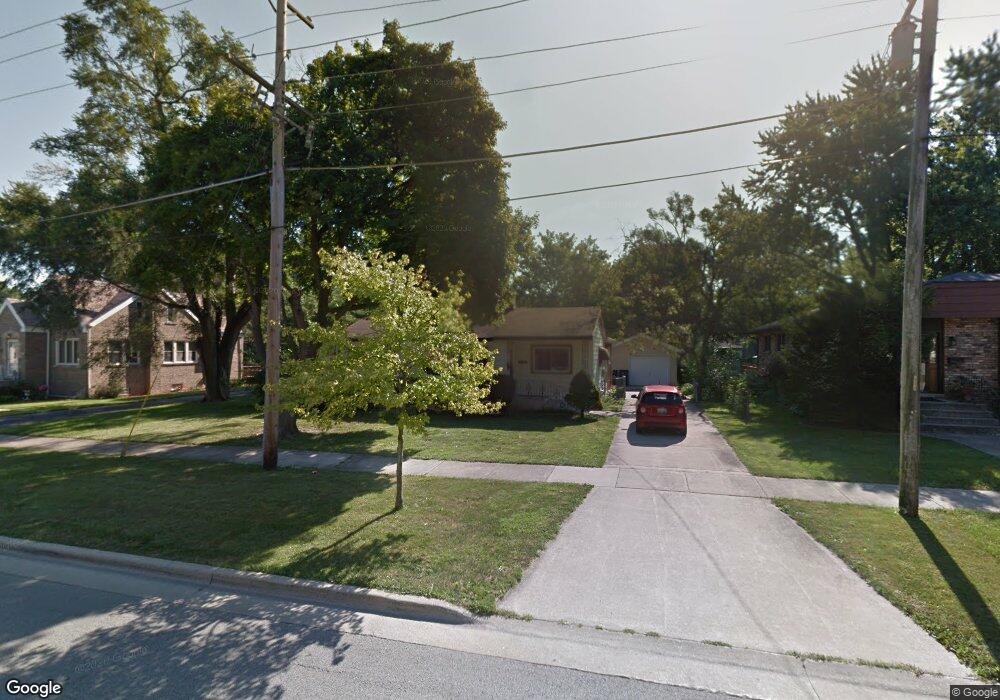
21129 Main St Matteson, IL 60443
Old Matteson NeighborhoodEstimated Value: $161,000 - $183,000
3
Beds
1
Bath
1,188
Sq Ft
$144/Sq Ft
Est. Value
About This Home
This home is located at 21129 Main St, Matteson, IL 60443 and is currently estimated at $170,690, approximately $143 per square foot. 21129 Main St is a home located in Cook County with nearby schools including Illinois School, Matteson Elementary School, and Sauk Elementary School.
Ownership History
Date
Name
Owned For
Owner Type
Purchase Details
Closed on
Jan 18, 1999
Sold by
Dixey Shirley Ann
Bought by
Bodine Kevin D and Bodine Diedre E
Current Estimated Value
Home Financials for this Owner
Home Financials are based on the most recent Mortgage that was taken out on this home.
Original Mortgage
$48,900
Outstanding Balance
$10,577
Interest Rate
6.76%
Estimated Equity
$160,113
Purchase Details
Closed on
Nov 15, 1996
Sold by
Martin William N
Bought by
Martin William N
Create a Home Valuation Report for This Property
The Home Valuation Report is an in-depth analysis detailing your home's value as well as a comparison with similar homes in the area
Home Values in the Area
Average Home Value in this Area
Purchase History
| Date | Buyer | Sale Price | Title Company |
|---|---|---|---|
| Bodine Kevin D | $84,000 | -- | |
| Martin William N | -- | -- |
Source: Public Records
Mortgage History
| Date | Status | Borrower | Loan Amount |
|---|---|---|---|
| Open | Bodine Kevin D | $48,900 |
Source: Public Records
Tax History
| Year | Tax Paid | Tax Assessment Tax Assessment Total Assessment is a certain percentage of the fair market value that is determined by local assessors to be the total taxable value of land and additions on the property. | Land | Improvement |
|---|---|---|---|---|
| 2025 | $4,416 | $14,000 | $4,290 | $9,710 |
| 2024 | $4,416 | $14,000 | $4,290 | $9,710 |
| 2023 | $2,310 | $14,000 | $4,290 | $9,710 |
| 2022 | $2,310 | $7,681 | $3,754 | $3,927 |
| 2021 | $2,392 | $7,679 | $3,753 | $3,926 |
| 2020 | $2,331 | $7,679 | $3,753 | $3,926 |
| 2019 | $2,841 | $8,918 | $3,485 | $5,433 |
| 2018 | $2,837 | $8,918 | $3,485 | $5,433 |
| 2017 | $2,753 | $8,918 | $3,485 | $5,433 |
| 2016 | $2,909 | $8,414 | $3,217 | $5,197 |
| 2015 | $2,823 | $8,414 | $3,217 | $5,197 |
| 2014 | $2,760 | $8,414 | $3,217 | $5,197 |
| 2013 | $3,033 | $9,656 | $3,217 | $6,439 |
Source: Public Records
Map
Nearby Homes
- 21142 Locust St
- 3719 211th Place
- 3615 214th St
- 3421 Station Dr
- 30 Strauss Ln
- 126 Indiana St
- 3727 214th Place Unit 2
- 3704 215th St Unit 105
- 3919 214th St
- 3624 216th St
- 21406 S Jean Ave
- 442 Homan Ave
- 21617 Dogwood Rd Unit 1125
- 831 Violet Ln
- 20920 Governors Hwy
- 20601 Parthenon Way
- 21635 Dogwood Rd Unit 1165
- 20535 Marathon Ct
- 209 Indiana St
- 411 Seward St
Your Personal Tour Guide
Ask me questions while you tour the home.