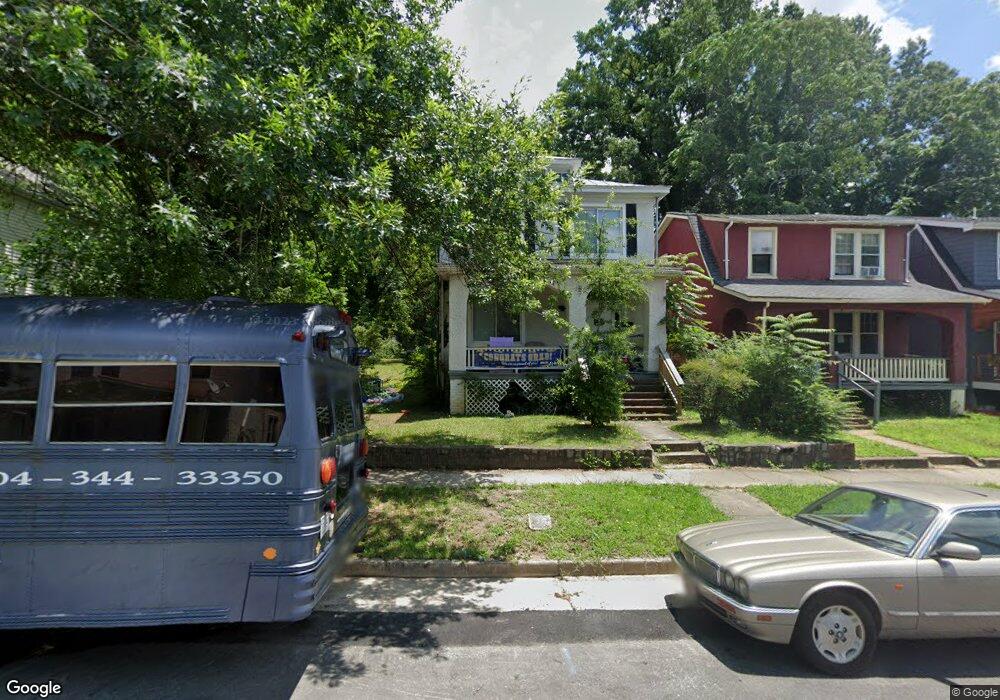
2113 2nd Ave Richmond, VA 23222
Chestnut Hill NeighborhoodEstimated Value: $222,000 - $294,000
4
Beds
2
Baths
1,484
Sq Ft
$181/Sq Ft
Est. Value
About This Home
This home is located at 2113 2nd Ave, Richmond, VA 23222 and is currently estimated at $268,782, approximately $181 per square foot. 2113 2nd Ave is a home located in Richmond City with nearby schools including Overby-Sheppard Elementary School, Henderson Middle School, and Open High School.
Ownership History
Date
Name
Owned For
Owner Type
Purchase Details
Closed on
Mar 13, 2017
Sold by
Wetsel Mark
Bought by
Chunns Cove Construction Llc A Virginia
Current Estimated Value
Purchase Details
Closed on
Oct 12, 2016
Sold by
3012 Park Avenue Llc A Virginia Limited
Bought by
Wetsel Mark
Purchase Details
Closed on
Jun 19, 2013
Sold by
Kleyman Daniil and Belashchenko Eugene
Bought by
3012 Avenue Llc
Home Financials for this Owner
Home Financials are based on the most recent Mortgage that was taken out on this home.
Original Mortgage
$166,391
Interest Rate
4.45%
Mortgage Type
Credit Line Revolving
Purchase Details
Closed on
Feb 2, 2009
Sold by
Hsbc Bank Usa
Bought by
Kleyman Daniil
Purchase Details
Closed on
Apr 27, 2005
Sold by
Robinson James
Bought by
Bullock Mark
Home Financials for this Owner
Home Financials are based on the most recent Mortgage that was taken out on this home.
Original Mortgage
$105,825
Interest Rate
5.95%
Mortgage Type
New Conventional
Create a Home Valuation Report for This Property
The Home Valuation Report is an in-depth analysis detailing your home's value as well as a comparison with similar homes in the area
Home Values in the Area
Average Home Value in this Area
Purchase History
We collect this data history from publicly available records. To have your information removed, we recommend requesting removal directly through your county’s website.
| Date | Buyer | Sale Price | Title Company |
|---|---|---|---|
| Chunns Cove Construction Llc A Virginia | -- | None Available | |
| Wetsel Mark | $60,000 | Attorney | |
| 3012 Avenue Llc | -- | -- | |
| Kleyman Daniil | $26,000 | -- | |
| Bullock Mark | $124,500 | -- |
Source: Public Records
Mortgage History
We collect this data history from publicly available records. To have your information removed, we recommend requesting removal directly through your county’s website.
| Date | Status | Borrower | Loan Amount |
|---|---|---|---|
| Previous Owner | 3012 Avenue Llc | $166,391 | |
| Previous Owner | Bullock Mark | $105,825 |
Source: Public Records
Tax History
| Year | Tax Paid | Tax Assessment Tax Assessment Total Assessment is a certain percentage of the fair market value that is determined by local assessors to be the total taxable value of land and additions on the property. | Land | Improvement |
|---|---|---|---|---|
| 2026 | $1,980 | $198,000 | $60,000 | $138,000 |
| 2025 | $1,920 | $165,000 | $60,000 | $105,000 |
| 2024 | $1,920 | $160,000 | $58,000 | $102,000 |
| 2023 | $1,920 | $160,000 | $58,000 | $102,000 |
| 2022 | $1,620 | $135,000 | $42,000 | $93,000 |
| 2020 | $1,476 | $123,000 | $32,000 | $91,000 |
| 2019 | $1,176 | $98,000 | $23,000 | $75,000 |
| 2018 | $1,176 | $98,000 | $23,000 | $75,000 |
| 2017 | $1,152 | $96,000 | $22,000 | $74,000 |
| 2016 | $1,128 | $94,000 | $22,000 | $72,000 |
| 2015 | $1,188 | $92,000 | $22,000 | $70,000 |
| 2014 | $1,188 | $99,000 | $22,000 | $77,000 |
Source: Public Records
Map
Nearby Homes
- 2200 3rd Ave
- 2118 4th Ave
- 1200 Juniper St
- 661 Juniper St
- 625 Juniper St
- 1902 3rd Ave
- 2102 5th Ave
- 2305 Overby Bend Rd
- 2301 Overby Bend Rd
- 673 School Center Aly
- 665 Ellens Haven Aly
- 653 Ellens Haven Aly
- 633 Ellens Haven Aly
- 2321 Overby Bend Rd
- 629 Ellens Haven Aly
- 656 Overby Bend Rd
- 625 Ellens Haven Aly
- 629 Dove St
- 652 Overby Bend Rd
- 621 Ellens Haven Aly
Your Personal Tour Guide
Ask me questions while you tour the home.