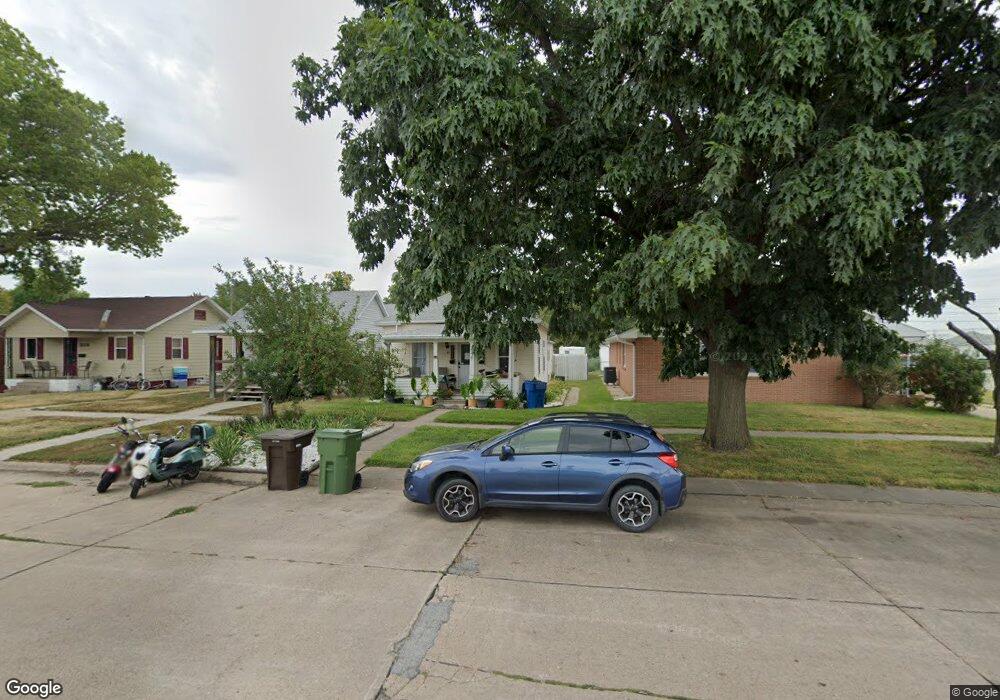
2113 B Ave Kearney, NE 68847
Estimated Value: $151,724 - $204,000
2
Beds
1
Bath
793
Sq Ft
$223/Sq Ft
Est. Value
About This Home
This home is located at 2113 B Ave, Kearney, NE 68847 and is currently estimated at $176,681, approximately $222 per square foot. 2113 B Ave is a home located in Buffalo County with nearby schools including Emerson Elementary School, Sunrise Middle School, and Kearney Senior High School.
Ownership History
Date
Name
Owned For
Owner Type
Purchase Details
Closed on
Sep 2, 2020
Sold by
Niemeyer Joshua A and Niemeyer Krystal N
Bought by
Decker Joseph S
Current Estimated Value
Home Financials for this Owner
Home Financials are based on the most recent Mortgage that was taken out on this home.
Original Mortgage
$123,675
Outstanding Balance
$109,550
Interest Rate
2.8%
Mortgage Type
New Conventional
Estimated Equity
$67,131
Purchase Details
Closed on
Feb 15, 2006
Sold by
Kearney Custom Design Inc
Bought by
Swanson Robert M and Swanson Norma J
Create a Home Valuation Report for This Property
The Home Valuation Report is an in-depth analysis detailing your home's value as well as a comparison with similar homes in the area
Home Values in the Area
Average Home Value in this Area
Purchase History
| Date | Buyer | Sale Price | Title Company |
|---|---|---|---|
| Decker Joseph S | $128,000 | Nebraska Title Co | |
| Swanson Robert M | -- | -- |
Source: Public Records
Mortgage History
| Date | Status | Borrower | Loan Amount |
|---|---|---|---|
| Open | Decker Joseph S | $123,675 |
Source: Public Records
Tax History Compared to Growth
Tax History
| Year | Tax Paid | Tax Assessment Tax Assessment Total Assessment is a certain percentage of the fair market value that is determined by local assessors to be the total taxable value of land and additions on the property. | Land | Improvement |
|---|---|---|---|---|
| 2025 | $1,315 | $106,545 | $17,555 | $88,990 |
| 2024 | $1,315 | $97,815 | $17,045 | $80,770 |
| 2023 | $1,448 | $85,060 | $17,045 | $68,015 |
| 2022 | $1,478 | $84,215 | $16,770 | $67,445 |
| 2021 | $1,358 | $78,765 | $14,250 | $64,515 |
| 2020 | $1,340 | $77,460 | $14,835 | $62,625 |
| 2019 | $1,246 | $71,140 | $14,925 | $56,215 |
| 2018 | $777 | $44,990 | $14,925 | $30,065 |
| 2017 | $672 | $39,170 | $14,925 | $24,245 |
| 2016 | $444 | $26,115 | $14,925 | $11,190 |
| 2015 | $557 | $32,035 | $0 | $0 |
| 2014 | $370 | $19,390 | $0 | $0 |
Source: Public Records
Map
Nearby Homes