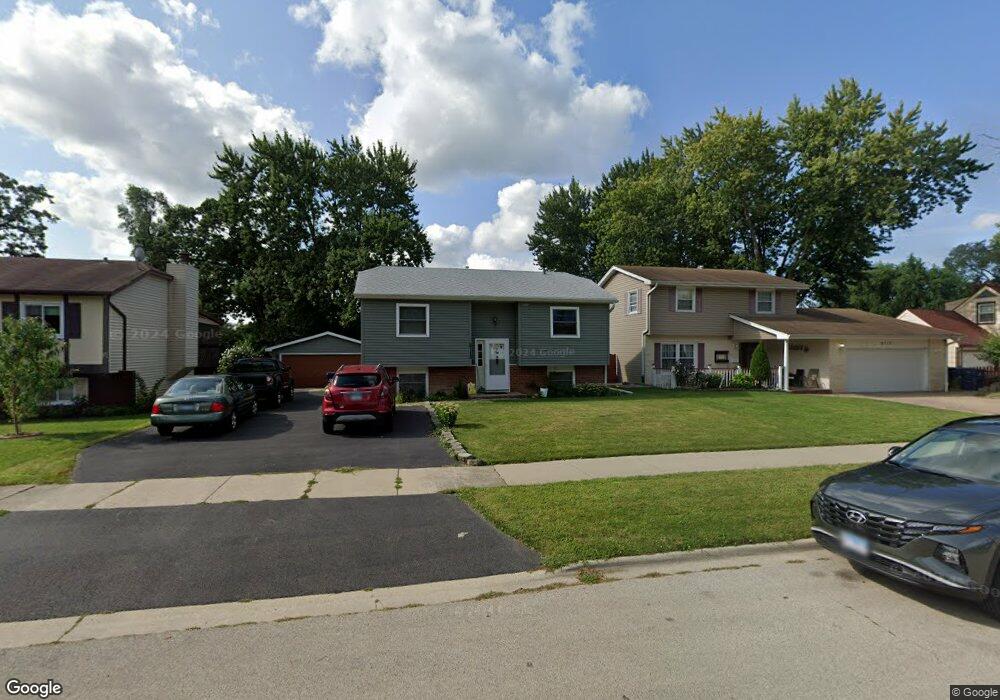
2113 Devonshire Rd Waukegan, IL 60087
Estimated Value: $238,000 - $247,030
4
Beds
2
Baths
788
Sq Ft
$308/Sq Ft
Est. Value
About This Home
This home is located at 2113 Devonshire Rd, Waukegan, IL 60087 and is currently estimated at $242,758, approximately $308 per square foot. 2113 Devonshire Rd is a home located in Lake County with nearby schools including H R McCall Elementary School, Jack Benny Middle School, and Waukegan High School.
Ownership History
Date
Name
Owned For
Owner Type
Purchase Details
Closed on
Feb 10, 2021
Sold by
Felix Alfreda
Bought by
Felix Alfreda and Solano Froylan
Current Estimated Value
Purchase Details
Closed on
Sep 24, 2005
Sold by
Torres Miguel A and Torres Christine M
Bought by
Felix Alfreda
Home Financials for this Owner
Home Financials are based on the most recent Mortgage that was taken out on this home.
Original Mortgage
$155,325
Outstanding Balance
$83,451
Interest Rate
5.82%
Mortgage Type
Fannie Mae Freddie Mac
Estimated Equity
$159,307
Purchase Details
Closed on
Aug 27, 1998
Sold by
Kluzak Rodney W
Bought by
Torres Miguel A and Torres Christine M
Home Financials for this Owner
Home Financials are based on the most recent Mortgage that was taken out on this home.
Original Mortgage
$102,600
Interest Rate
6.99%
Create a Home Valuation Report for This Property
The Home Valuation Report is an in-depth analysis detailing your home's value as well as a comparison with similar homes in the area
Purchase History
| Date | Buyer | Sale Price | Title Company |
|---|---|---|---|
| Felix Alfreda | -- | None Available | |
| Felix Alfreda | $163,500 | Attorneys Title Guaranty Fun | |
| Torres Miguel A | $108,000 | Standard Title |
Source: Public Records
Mortgage History
| Date | Status | Borrower | Loan Amount |
|---|---|---|---|
| Open | Felix Alfreda | $155,325 | |
| Previous Owner | Torres Miguel A | $102,600 |
Source: Public Records
Tax History
| Year | Tax Paid | Tax Assessment Tax Assessment Total Assessment is a certain percentage of the fair market value that is determined by local assessors to be the total taxable value of land and additions on the property. | Land | Improvement |
|---|---|---|---|---|
| 2024 | $4,330 | $70,770 | $10,607 | $60,163 |
| 2023 | $4,251 | $63,915 | $9,582 | $54,333 |
| 2022 | $4,251 | $56,480 | $8,217 | $48,263 |
| 2021 | $4,125 | $52,014 | $7,824 | $44,190 |
| 2020 | $4,586 | $48,457 | $7,289 | $41,168 |
| 2019 | $4,545 | $44,403 | $6,679 | $37,724 |
| 2018 | $3,705 | $37,162 | $8,595 | $28,567 |
| 2017 | $3,539 | $32,878 | $7,604 | $25,274 |
| 2016 | $3,488 | $28,570 | $6,608 | $21,962 |
| 2015 | $3,306 | $25,570 | $5,914 | $19,656 |
| 2014 | $2,989 | $23,204 | $6,135 | $17,069 |
| 2012 | $3,924 | $25,139 | $6,646 | $18,493 |
Source: Public Records
Map
Nearby Homes
- 1507 W York House Rd
- 3101 Country Club Ln
- 2936 Witchwood Ln
- 1730 W Beach Rd
- 2820 N Elmwood Ave
- 2805 N Elmwood Ave
- 1403 W Beach Rd
- 38169 N North Shore Ave
- 38546 N Pine Ave
- 38132 N Manor Ave
- 2629 N Mcaree Rd
- 11471 W Leland Ave
- 12346 W Sallmon Ave
- 38633 N Cedar Ave
- 38119 N Wilson Ave
- 2705 Jacquelyn Ln
- 12707 W Warner St
- 2605 N Pine St
- 3805 Bertrand Ln
- 1136 10 Pin Ln
- 2109 Devonshire Rd
- 2117 Devonshire Rd
- 2112 Dover Rd
- 2121 Devonshire Rd
- 2116 Dover Rd
- 2108 Dover Rd
- 2120 Dover Rd
- 3312 Newcastle Rd
- 3316 Newcastle Rd Unit 1
- 2112 Devonshire Rd Unit 2
- 2201 Devonshire Rd
- 2108 Devonshire Rd
- 2116 Devonshire Rd
- 3308 Newcastle Rd
- 2104 Devonshire Rd
- 2120 Devonshire Rd
- 2200 Dover Rd
- 2205 Devonshire Rd
- 2200 Devonshire Rd
- 2100 Devonshire Rd
Your Personal Tour Guide
Ask me questions while you tour the home.