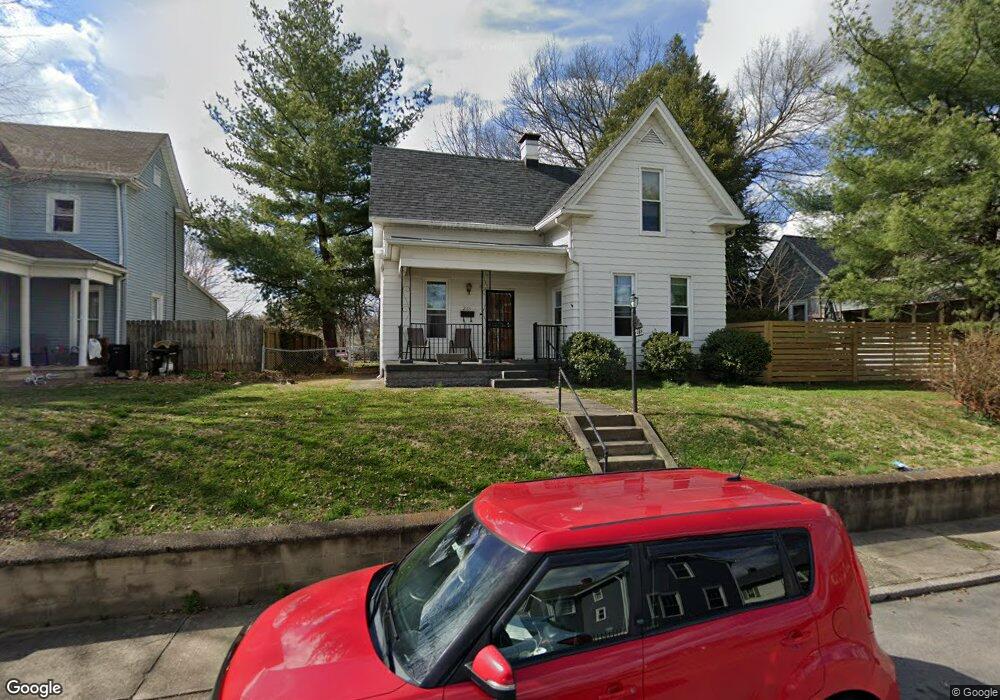
2113 E Elm St New Albany, IN 47150
Estimated Value: $224,000 - $260,633
3
Beds
2
Baths
1,946
Sq Ft
$122/Sq Ft
Est. Value
About This Home
This home is located at 2113 E Elm St, New Albany, IN 47150 and is currently estimated at $237,408, approximately $121 per square foot. 2113 E Elm St is a home located in Floyd County with nearby schools including Slate Run Elementary School, Hazelwood Middle School, and New Albany Senior High School.
Ownership History
Date
Name
Owned For
Owner Type
Purchase Details
Closed on
Aug 12, 2011
Sold by
Hamilton Phyllis P and Warlick Sharon R
Bought by
Barrett Matthew W and Barrett Tracy A
Current Estimated Value
Home Financials for this Owner
Home Financials are based on the most recent Mortgage that was taken out on this home.
Original Mortgage
$83,325
Outstanding Balance
$58,175
Interest Rate
4.75%
Mortgage Type
FHA
Estimated Equity
$179,233
Purchase Details
Closed on
Jun 24, 2011
Sold by
Hamilton Phyllip P
Bought by
Hamilton Phyllis P and Warlick Sharon R
Home Financials for this Owner
Home Financials are based on the most recent Mortgage that was taken out on this home.
Original Mortgage
$83,325
Outstanding Balance
$58,175
Interest Rate
4.75%
Mortgage Type
FHA
Estimated Equity
$179,233
Create a Home Valuation Report for This Property
The Home Valuation Report is an in-depth analysis detailing your home's value as well as a comparison with similar homes in the area
Home Values in the Area
Average Home Value in this Area
Purchase History
| Date | Buyer | Sale Price | Title Company |
|---|---|---|---|
| Barrett Matthew W | -- | None Available | |
| Hamilton Phyllis P | -- | None Available |
Source: Public Records
Mortgage History
| Date | Status | Borrower | Loan Amount |
|---|---|---|---|
| Open | Barrett Matthew W | $83,325 |
Source: Public Records
Tax History Compared to Growth
Tax History
| Year | Tax Paid | Tax Assessment Tax Assessment Total Assessment is a certain percentage of the fair market value that is determined by local assessors to be the total taxable value of land and additions on the property. | Land | Improvement |
|---|---|---|---|---|
| 2024 | $1,762 | $167,000 | $16,000 | $151,000 |
| 2023 | $1,579 | $149,700 | $16,000 | $133,700 |
| 2022 | $1,477 | $139,900 | $16,000 | $123,900 |
| 2021 | $1,360 | $128,200 | $16,000 | $112,200 |
| 2020 | $1,243 | $122,700 | $16,000 | $106,700 |
| 2019 | $1,032 | $112,300 | $16,000 | $96,300 |
| 2018 | $1,006 | $111,200 | $16,000 | $95,200 |
| 2017 | $852 | $100,800 | $16,000 | $84,800 |
| 2016 | $777 | $99,900 | $16,000 | $83,900 |
| 2014 | $740 | $93,000 | $15,900 | $77,100 |
| 2013 | -- | $98,600 | $16,000 | $82,600 |
Source: Public Records
Map
Nearby Homes
- 2124 E Oak St
- 2131 Culbertson Ave
- 2119 Reno Ave
- 2231 E Oak St
- 2215 Reno Ave
- 2219 Reno Ave
- 2107 E Market St
- 1922 Division St
- 1935 Center St
- 1919 Center St
- 1913 Center St
- 2024 E Market St
- 2117 Willow St
- 237 Silver St
- 1809 E Oak St
- 916 Korb Ave
- 1748 E Oak St
- 1743 E Spring St
- The Warner II Plan at Greenway Commons
- The Warner Plan at Greenway Commons