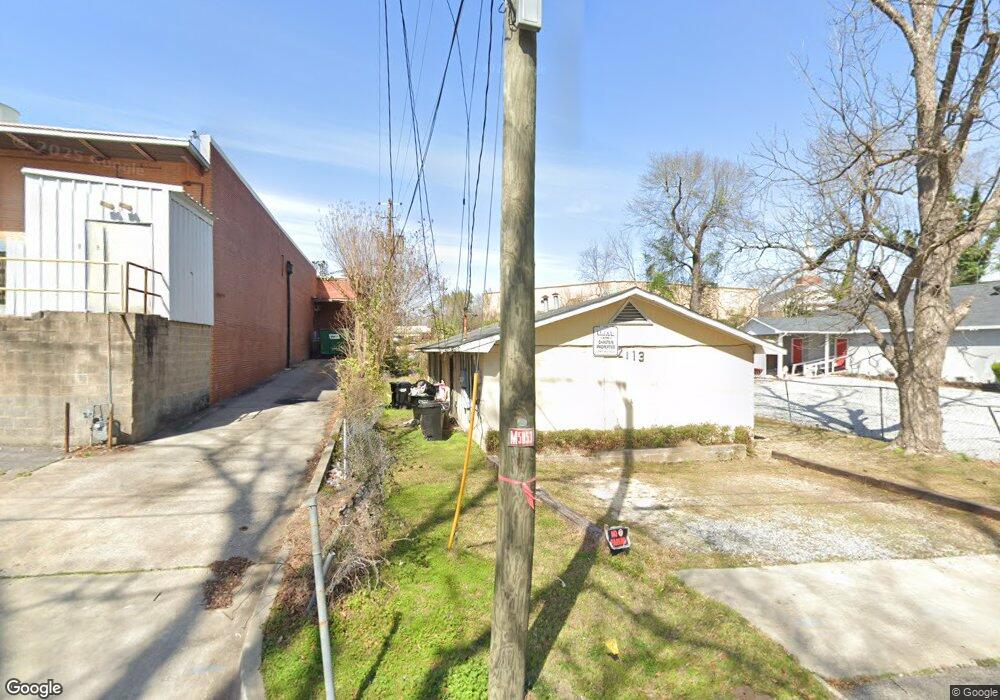
2113 George St Columbus, GA 31906
East Wynnton-Wynnton Hill NeighborhoodEstimated Value: $63,891 - $85,000
4
Beds
3
Baths
1,200
Sq Ft
$62/Sq Ft
Est. Value
About This Home
This home is located at 2113 George St, Columbus, GA 31906 and is currently estimated at $74,223, approximately $61 per square foot. 2113 George St is a home located in Muscogee County with nearby schools including Davis Elementary School, Baker Middle School, and Carver High School.
Ownership History
Date
Name
Owned For
Owner Type
Purchase Details
Closed on
Dec 23, 2017
Sold by
Chastain Joy B
Bought by
Chastain Homes Llc
Current Estimated Value
Purchase Details
Closed on
Jul 6, 2010
Sold by
Meeks Randy Scott
Bought by
Chastain Joseph B
Purchase Details
Closed on
Nov 29, 2007
Sold by
Bibb Rentals Llc and Hilton Jason
Bought by
Meeks Randy Scott
Home Financials for this Owner
Home Financials are based on the most recent Mortgage that was taken out on this home.
Original Mortgage
$50,000
Interest Rate
6.21%
Mortgage Type
Seller Take Back
Purchase Details
Closed on
Aug 27, 2007
Sold by
Federal National Mortgage Association
Bought by
Bibb Rentals Llc
Purchase Details
Closed on
Jun 5, 2007
Sold by
Bass Ervina and Bass Addie Jerry
Bought by
Federal National Mortgage Association
Create a Home Valuation Report for This Property
The Home Valuation Report is an in-depth analysis detailing your home's value as well as a comparison with similar homes in the area
Home Values in the Area
Average Home Value in this Area
Purchase History
| Date | Buyer | Sale Price | Title Company |
|---|---|---|---|
| Chastain Homes Llc | $360,279 | -- | |
| Chastain Joy B | $360,279 | -- | |
| Chastain Joseph B | $15,010 | None Available | |
| Meeks Randy Scott | $52,500 | None Available | |
| Bibb Rentals Llc | -- | None Available | |
| Federal National Mortgage Association | $27,057 | None Available |
Source: Public Records
Mortgage History
| Date | Status | Borrower | Loan Amount |
|---|---|---|---|
| Previous Owner | Meeks Randy Scott | $50,000 |
Source: Public Records
Tax History
| Year | Tax Paid | Tax Assessment Tax Assessment Total Assessment is a certain percentage of the fair market value that is determined by local assessors to be the total taxable value of land and additions on the property. | Land | Improvement |
|---|---|---|---|---|
| 2025 | $782 | $19,972 | $3,528 | $16,444 |
| 2024 | $782 | $19,972 | $3,528 | $16,444 |
| 2023 | $787 | $19,972 | $3,528 | $16,444 |
| 2022 | $758 | $18,564 | $3,528 | $15,036 |
| 2021 | $724 | $17,728 | $3,528 | $14,200 |
| 2020 | $724 | $17,728 | $3,528 | $14,200 |
| 2019 | $726 | $17,728 | $3,528 | $14,200 |
| 2018 | $726 | $17,728 | $3,528 | $14,200 |
| 2017 | $729 | $17,728 | $3,528 | $14,200 |
| 2016 | $660 | $16,000 | $1,100 | $14,900 |
| 2015 | $661 | $16,000 | $1,100 | $14,900 |
| 2014 | $662 | $16,000 | $1,100 | $14,900 |
| 2013 | -- | $16,000 | $1,100 | $14,900 |
Source: Public Records
Map
Nearby Homes
Your Personal Tour Guide
Ask me questions while you tour the home.