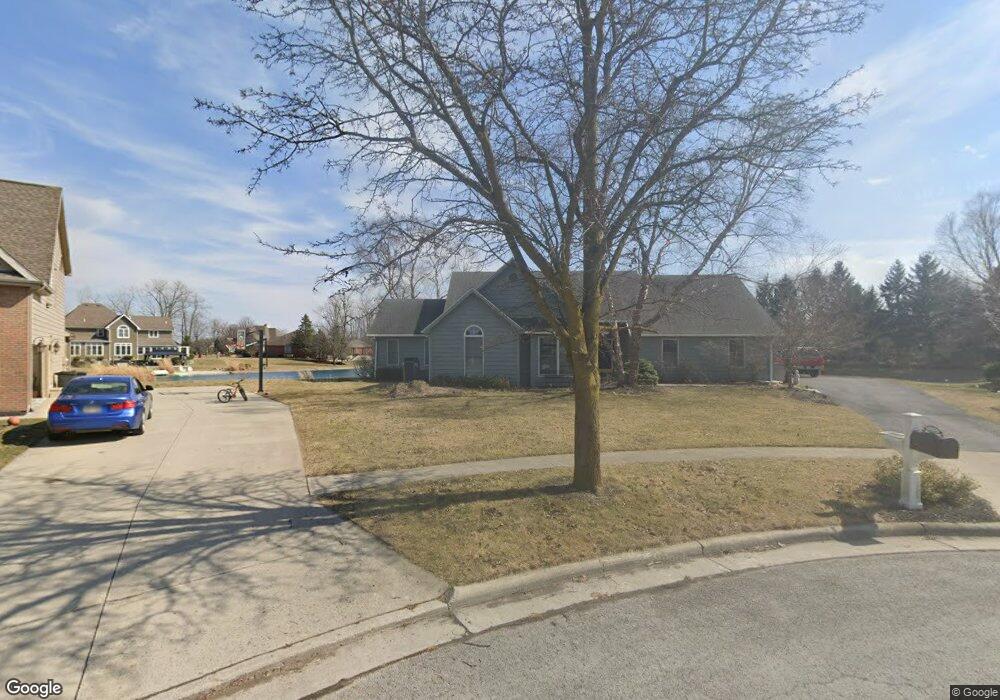
2113 Golden Eagle Dr Findlay, OH 45840
Estimated Value: $481,497 - $641,000
5
Beds
3
Baths
2,308
Sq Ft
$233/Sq Ft
Est. Value
About This Home
This home is located at 2113 Golden Eagle Dr, Findlay, OH 45840 and is currently estimated at $538,624, approximately $233 per square foot. 2113 Golden Eagle Dr is a home located in Hancock County with nearby schools including Jefferson Elementary School, Chamberlin Hill Elementary School, and Donnell Middle School.
Ownership History
Date
Name
Owned For
Owner Type
Purchase Details
Closed on
Feb 5, 2018
Sold by
Bowers Timothy A and Bowers Krisann E
Bought by
Beers Edward C and Beers Carol Marie
Current Estimated Value
Home Financials for this Owner
Home Financials are based on the most recent Mortgage that was taken out on this home.
Original Mortgage
$383,062
Outstanding Balance
$324,825
Interest Rate
4.04%
Mortgage Type
VA
Estimated Equity
$213,799
Purchase Details
Closed on
Mar 16, 2010
Sold by
Bowers Timothy A and Bowers Krisann E
Bought by
Timothy A Bowers Revocable Trust
Purchase Details
Closed on
Nov 17, 1995
Sold by
Garlock/Kuhlman Dev
Bought by
Bowers Timothy and Bowers Krisann
Home Financials for this Owner
Home Financials are based on the most recent Mortgage that was taken out on this home.
Original Mortgage
$190,900
Interest Rate
7.65%
Mortgage Type
New Conventional
Create a Home Valuation Report for This Property
The Home Valuation Report is an in-depth analysis detailing your home's value as well as a comparison with similar homes in the area
Home Values in the Area
Average Home Value in this Area
Purchase History
| Date | Buyer | Sale Price | Title Company |
|---|---|---|---|
| Beers Edward C | $375,000 | Mid And Title | |
| Timothy A Bowers Revocable Trust | -- | None Available | |
| Bowers Timothy | $40,000 | -- |
Source: Public Records
Mortgage History
| Date | Status | Borrower | Loan Amount |
|---|---|---|---|
| Open | Beers Edward C | $383,062 | |
| Previous Owner | Bowers Timothy | $190,900 |
Source: Public Records
Tax History
| Year | Tax Paid | Tax Assessment Tax Assessment Total Assessment is a certain percentage of the fair market value that is determined by local assessors to be the total taxable value of land and additions on the property. | Land | Improvement |
|---|---|---|---|---|
| 2024 | $4,669 | $131,450 | $26,780 | $104,670 |
| 2023 | $4,677 | $131,450 | $26,780 | $104,670 |
| 2022 | $4,660 | $131,450 | $26,780 | $104,670 |
| 2021 | $4,870 | $119,650 | $26,790 | $92,860 |
| 2020 | $4,869 | $119,650 | $26,790 | $92,860 |
| 2019 | $4,771 | $119,650 | $26,790 | $92,860 |
| 2018 | $4,524 | $104,040 | $23,290 | $80,750 |
| 2017 | $4,524 | $104,040 | $23,290 | $80,750 |
| 2016 | $4,441 | $104,040 | $23,290 | $80,750 |
| 2015 | $4,413 | $100,930 | $22,150 | $78,780 |
| 2014 | $4,414 | $100,930 | $22,150 | $78,780 |
| 2012 | $5,008 | $113,760 | $22,150 | $91,610 |
Source: Public Records
Map
Nearby Homes
- 1726 Eastview Dr
- 1709 Eastview Dr
- 0 Township Road 227
- 242 E Yates Ave
- 225 E Yates Ave
- 209 E Hobart Ave
- 731 5th St
- 136 E Hobart Ave
- 331 Fairlawn Place
- 1100 Stall Dr
- 315 Fairlawn Place
- 0 Blanchard Ave
- 206 Greenlawn Ave
- 123 Glendale Ave
- 3001 Goldenrod Ln
- 1037 Fishlock Ave
- 151 Marilyn Dr
- 1200 1st St
- 1304 Douglas Pkwy
- 2925 Goldenrod Ln
- 2109 Golden Eagle Dr
- 2116 Golden Eagle Dr
- 2105 Golden Eagle Dr
- 2112 Golden Eagle Dr
- 2112 Eagle Hill Ct
- 2108 Golden Eagle Dr
- 2108 Eagle Hill Ct
- 2101 Golden Eagle Dr
- 2116 Eagle Hill Ct
- 2104 Golden Eagle Dr
- 2104 Eagle Hill Ct
- 2100 Eagle Hill Ct
- 2113 Eagle Hill Ct
- 934 Eagle Ridge Dr
- 930 Eagle Ridge Dr
- 932 Eagle Ridge Dr
- 2117 Eagle Hill Ct
- 2109 Eagle Hill Ct
- 2101 Eagle Hill Ct
- 2105 Eagle Hill Ct
Your Personal Tour Guide
Ask me questions while you tour the home.