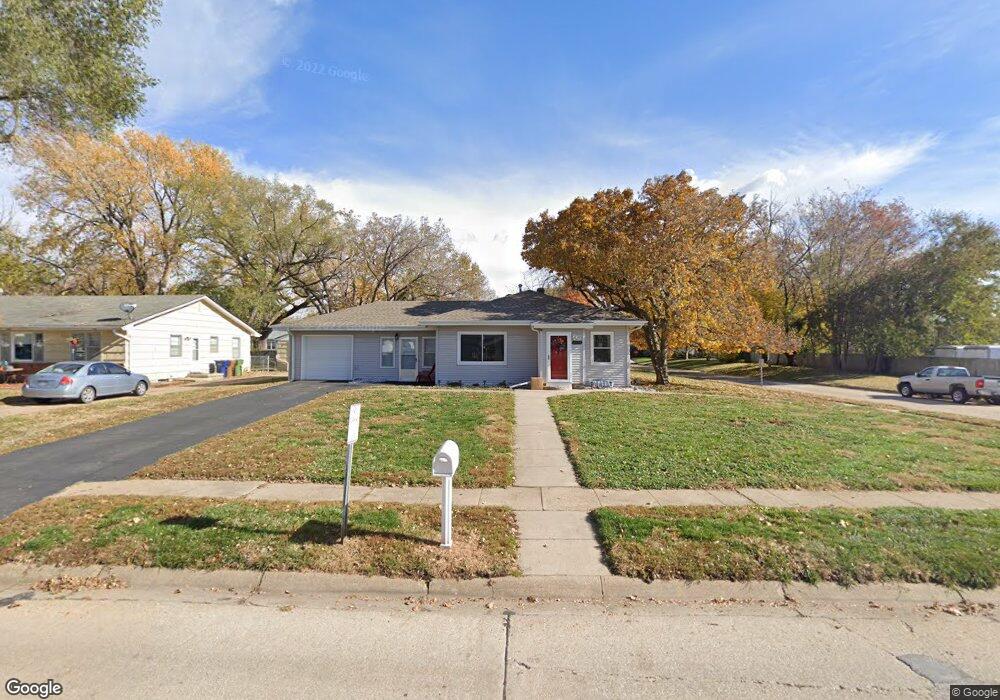
2113 Hancock St Bellevue, NE 68005
Estimated Value: $207,297 - $267,000
3
Beds
2
Baths
1,262
Sq Ft
$193/Sq Ft
Est. Value
About This Home
This home is located at 2113 Hancock St, Bellevue, NE 68005 and is currently estimated at $243,074, approximately $192 per square foot. 2113 Hancock St is a home located in Sarpy County with nearby schools including Bertha Barber Elementary School, Bellevue Mission Middle School, and Bellevue East High School.
Ownership History
Date
Name
Owned For
Owner Type
Purchase Details
Closed on
Nov 15, 2011
Sold by
Michalski Daniel and Michalski Daniel N
Bought by
Michalski Heather and Michalski Heather M
Current Estimated Value
Purchase Details
Closed on
Oct 12, 2006
Sold by
Michalski Heather and Michalski Daniel
Bought by
Michalski Daniel and Michalski Heather
Home Financials for this Owner
Home Financials are based on the most recent Mortgage that was taken out on this home.
Original Mortgage
$33,950
Interest Rate
6.37%
Mortgage Type
New Conventional
Purchase Details
Closed on
Jan 31, 2005
Sold by
Mills Joshua James
Bought by
Mills Heather Marie
Purchase Details
Closed on
Aug 8, 2002
Sold by
Weber Rose Ann and Weber Roseanne
Bought by
Mills Joshua J and Mills Heather M
Home Financials for this Owner
Home Financials are based on the most recent Mortgage that was taken out on this home.
Original Mortgage
$119,050
Interest Rate
6.41%
Mortgage Type
FHA
Create a Home Valuation Report for This Property
The Home Valuation Report is an in-depth analysis detailing your home's value as well as a comparison with similar homes in the area
Home Values in the Area
Average Home Value in this Area
Purchase History
| Date | Buyer | Sale Price | Title Company |
|---|---|---|---|
| Michalski Heather | -- | None Available | |
| Michalski Daniel | -- | None Available | |
| Mills Heather Marie | -- | -- | |
| Mills Joshua J | $120,000 | -- |
Source: Public Records
Mortgage History
| Date | Status | Borrower | Loan Amount |
|---|---|---|---|
| Closed | Michalski Daniel | $33,950 | |
| Previous Owner | Mills Joshua J | $119,050 |
Source: Public Records
Tax History
| Year | Tax Paid | Tax Assessment Tax Assessment Total Assessment is a certain percentage of the fair market value that is determined by local assessors to be the total taxable value of land and additions on the property. | Land | Improvement |
|---|---|---|---|---|
| 2025 | $3,794 | $239,883 | $32,000 | $207,883 |
| 2024 | $4,048 | $216,312 | $27,000 | $189,312 |
| 2023 | $4,048 | $191,690 | $27,000 | $164,690 |
| 2022 | $3,613 | $167,888 | $22,000 | $145,888 |
| 2021 | $3,454 | $158,801 | $20,000 | $138,801 |
| 2020 | $3,302 | $151,332 | $20,000 | $131,332 |
| 2019 | $3,225 | $148,707 | $20,000 | $128,707 |
| 2018 | $2,984 | $141,285 | $20,000 | $121,285 |
| 2017 | $2,888 | $135,817 | $20,000 | $115,817 |
| 2016 | $2,692 | $129,419 | $20,000 | $109,419 |
| 2015 | $2,583 | $124,866 | $20,000 | $104,866 |
| 2014 | $2,554 | $122,695 | $20,000 | $102,695 |
| 2012 | -- | $123,072 | $20,000 | $103,072 |
Source: Public Records
Map
Nearby Homes
- 1908 Warren St
- 2309 Main St
- 2405 Hancock St
- 307 E 17th Ave
- 1701 Jefferson St
- 411 W 22nd Ave
- 2503 Washington St
- 2303 Madison St
- 2504 Washington St
- 2411 Madison St
- 1509 Warren St
- 2010 Jackson St
- 1404 Warren St
- 1807 Collins Dr
- 2802 Wayne St
- 1308 Main St
- 409 W 30th Ave
- 1105 Kountze Memorial Dr
- 3101 Washington St Unit 15
- 3101 Washington St Unit 53
- 2107 Hancock St Unit 2109
- 2105 Hancock St
- 212 E 22nd Ave
- 2110 Main St
- 2103 Hancock St
- 2108 Main St
- 2112 Hancock St
- 2106 Main St
- 2101 Hancock St
- 2104 Main St
- 2202 Main St
- 2106 Hancock St
- 2102 Main St
- 2102 Hancock St
- 204 E Mission Ave
- 204 E Mission
- 2011 Hancock St
- 301 E 22nd Ave
- 2111 Main St
- 2109 Main St
Your Personal Tour Guide
Ask me questions while you tour the home.