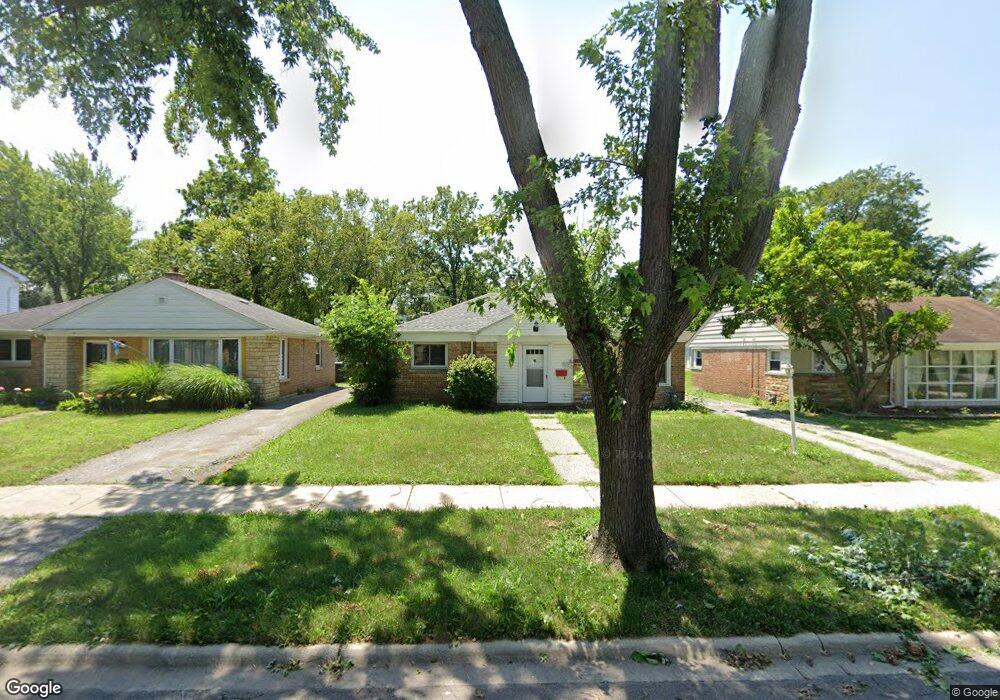
2113 Hawthorne Rd Homewood, IL 60430
Estimated Value: $170,000 - $185,000
2
Beds
1
Bath
952
Sq Ft
$184/Sq Ft
Est. Value
About This Home
This home is located at 2113 Hawthorne Rd, Homewood, IL 60430 and is currently estimated at $174,976, approximately $183 per square foot. 2113 Hawthorne Rd is a home located in Cook County with nearby schools including Willow Elementary School, Winston Churchill School, and James Hart School.
Ownership History
Date
Name
Owned For
Owner Type
Purchase Details
Closed on
Jun 20, 2019
Sold by
Second City Equity Llc
Bought by
Pilatus 257 Llc
Current Estimated Value
Purchase Details
Closed on
Jun 11, 2019
Sold by
Jpmorgan Chase Bank National Association
Bought by
Second City Equity Llc
Purchase Details
Closed on
Jan 15, 2019
Sold by
Corning Nellie K and Walsh Nellie K
Bought by
Jpmorgan Chase Bank Na
Purchase Details
Closed on
Apr 29, 2002
Sold by
Hansen Thomas J and Hansen Kathleen D
Bought by
Walsh Nellie K
Home Financials for this Owner
Home Financials are based on the most recent Mortgage that was taken out on this home.
Original Mortgage
$95,613
Interest Rate
7.18%
Mortgage Type
FHA
Purchase Details
Closed on
Oct 3, 1994
Sold by
Kemp Ronald George and Kemp Mary Evelyn
Bought by
Hansen Thomas J and Hansen Kathleen D
Create a Home Valuation Report for This Property
The Home Valuation Report is an in-depth analysis detailing your home's value as well as a comparison with similar homes in the area
Home Values in the Area
Average Home Value in this Area
Purchase History
| Date | Buyer | Sale Price | Title Company |
|---|---|---|---|
| Pilatus 257 Llc | $70,000 | Fidelity National Title | |
| Second City Equity Llc | $48,000 | Fidelity National Title | |
| Jpmorgan Chase Bank Na | -- | None Available | |
| Walsh Nellie K | -- | First American Title | |
| Hansen Thomas J | $89,900 | First American Title |
Source: Public Records
Mortgage History
| Date | Status | Borrower | Loan Amount |
|---|---|---|---|
| Previous Owner | Walsh Nellie K | $95,613 |
Source: Public Records
Tax History Compared to Growth
Tax History
| Year | Tax Paid | Tax Assessment Tax Assessment Total Assessment is a certain percentage of the fair market value that is determined by local assessors to be the total taxable value of land and additions on the property. | Land | Improvement |
|---|---|---|---|---|
| 2024 | $5,147 | $12,012 | $2,920 | $9,092 |
| 2023 | $4,154 | $13,000 | $2,920 | $10,080 |
| 2022 | $4,154 | $7,743 | $2,555 | $5,188 |
| 2021 | $3,873 | $7,743 | $2,555 | $5,188 |
| 2020 | $3,750 | $7,743 | $2,555 | $5,188 |
| 2019 | $2,820 | $9,046 | $2,372 | $6,674 |
| 2018 | $2,974 | $9,555 | $2,372 | $7,183 |
| 2017 | $3,007 | $9,555 | $2,372 | $7,183 |
| 2016 | $2,887 | $8,311 | $2,190 | $6,121 |
| 2015 | $2,798 | $8,311 | $2,190 | $6,121 |
| 2014 | $2,771 | $8,311 | $2,190 | $6,121 |
| 2013 | $2,851 | $9,064 | $2,190 | $6,874 |
Source: Public Records
Map
Nearby Homes
- 2109 Magnolia Rd
- 17739 Harwood Ave
- 2347 Spruce Rd
- 1850 Pine Rd
- 17510 Western Ave
- 2441 Spruce Rd
- 1758 Pine Rd
- 17919 Homewood Ave
- 2161 Oak Rd Unit 2C
- 17222 Country Ln
- 17218 Forestway Dr
- 18137 Martin Ave Unit 1NE
- 17212 Hawthorne Dr
- 1852 Sycamore Rd
- 1848 172nd St
- 1624 Burr Oak Rd
- 2612 175th St
- 2612 Turtle Creek Dr
- 1635 Linden Rd
- 1921 171st St
- 2119 Hawthorne Rd
- 2109 Hawthorne Rd
- 2103 Hawthorne Rd
- 2123 Hawthorne Rd
- 2061 Hawthorne Rd
- 2129 Hawthorne Rd
- 2118 Maple Rd
- 2114 Maple Rd
- 2126 Maple Rd
- 2055 Hawthorne Rd
- 2133 Hawthorne Rd
- 2112 Hawthorne Rd
- 2108 Hawthorne Rd
- 2118 Hawthorne Rd
- 2058 Maple Rd
- 2102 Hawthorne Rd
- 2132 Maple Rd
- 2122 Hawthorne Rd
- 2139 Hawthorne Rd
- 2049 Hawthorne Rd