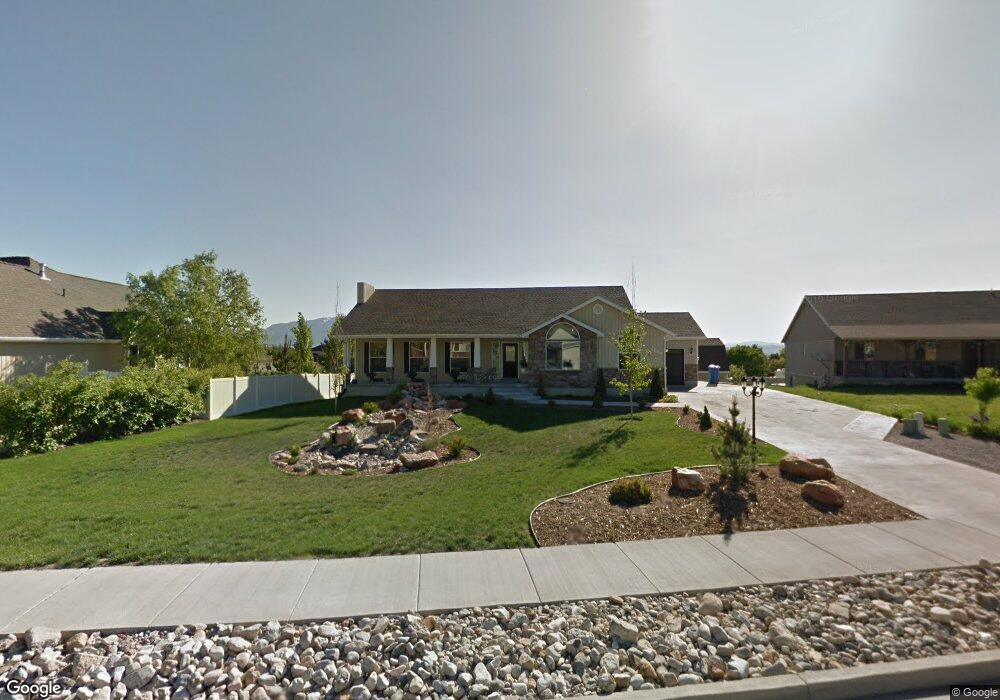
2113 N 728 E North Logan, UT 84341
Estimated Value: $750,000 - $896,866
6
Beds
3
Baths
5,217
Sq Ft
$160/Sq Ft
Est. Value
About This Home
This home is located at 2113 N 728 E, North Logan, UT 84341 and is currently estimated at $836,467, approximately $160 per square foot. 2113 N 728 E is a home located in Cache County with nearby schools including Greenville School, Cedar Ridge School, and North Cache Middle School.
Ownership History
Date
Name
Owned For
Owner Type
Purchase Details
Closed on
Dec 18, 2019
Sold by
Carlson Brian W and Carlson Kamilla K
Bought by
Disclaim Brian W and Carlson Fam Disclaim K D
Current Estimated Value
Purchase Details
Closed on
Feb 13, 2013
Sold by
Jones Isaac R and Jones Mary
Bought by
Carlson Brian W and Carlson Kamilla K
Home Financials for this Owner
Home Financials are based on the most recent Mortgage that was taken out on this home.
Original Mortgage
$285,600
Outstanding Balance
$197,834
Interest Rate
3.29%
Mortgage Type
New Conventional
Estimated Equity
$638,633
Purchase Details
Closed on
Aug 13, 2008
Sold by
Salisbury Mary
Bought by
Jones Isaac R and Jones Mary
Purchase Details
Closed on
Jun 21, 2006
Sold by
Greyeye Enterprises Inc
Bought by
Salisbury Mary
Create a Home Valuation Report for This Property
The Home Valuation Report is an in-depth analysis detailing your home's value as well as a comparison with similar homes in the area
Home Values in the Area
Average Home Value in this Area
Purchase History
| Date | Buyer | Sale Price | Title Company |
|---|---|---|---|
| Disclaim Brian W | -- | None Available | |
| Carlson Brian W | -- | American Secure Title Logan | |
| Jones Isaac R | -- | Cache Title Company | |
| Salisbury Mary | -- | American Secure Title |
Source: Public Records
Mortgage History
| Date | Status | Borrower | Loan Amount |
|---|---|---|---|
| Open | Carlson Brian W | $285,600 |
Source: Public Records
Tax History
| Year | Tax Paid | Tax Assessment Tax Assessment Total Assessment is a certain percentage of the fair market value that is determined by local assessors to be the total taxable value of land and additions on the property. | Land | Improvement |
|---|---|---|---|---|
| 2025 | $3,518 | $492,460 | $0 | $0 |
| 2024 | $3,881 | $505,560 | $0 | $0 |
| 2023 | $3,834 | $467,280 | $0 | $0 |
| 2022 | $4,012 | $467,280 | $0 | $0 |
| 2021 | $288 | $520,294 | $92,800 | $427,494 |
| 2020 | $2,743 | $464,534 | $92,800 | $371,734 |
| 2019 | $2,873 | $464,533 | $92,800 | $371,733 |
| 2018 | $2,531 | $396,905 | $65,000 | $331,905 |
| 2017 | $2,540 | $209,605 | $0 | $0 |
| 2016 | $2,580 | $188,650 | $0 | $0 |
| 2015 | $2,330 | $188,650 | $0 | $0 |
| 2014 | $2,275 | $188,650 | $0 | $0 |
| 2013 | -- | $185,075 | $0 | $0 |
Source: Public Records
Map
Nearby Homes
- 710 E 2160 N
- 2168 N 750 E
- 741 E 2200 N
- 2284 N 740 E
- 2048 N 350 E
- 385 E 2280 N Unit D
- 1593 N 110 W Unit 201
- 611 E 2450 N Unit 1
- 1593 N 110 W Unit 202
- 1593 N 110 W Unit 204
- 1200 W 1400 N
- 2950 N Mahogony Valley Rd E Unit 7
- 1598 N Sharptail Cir
- 1000 W 2500 N
- 327 E 2230 N Unit A
- 2469 N 620 E Unit 3
- 2477 N 620 E Unit 4
- 1872 N 515 W
- 1100 E 1900 N Unit 10
- 623 E 2475 N Unit 5
Your Personal Tour Guide
Ask me questions while you tour the home.