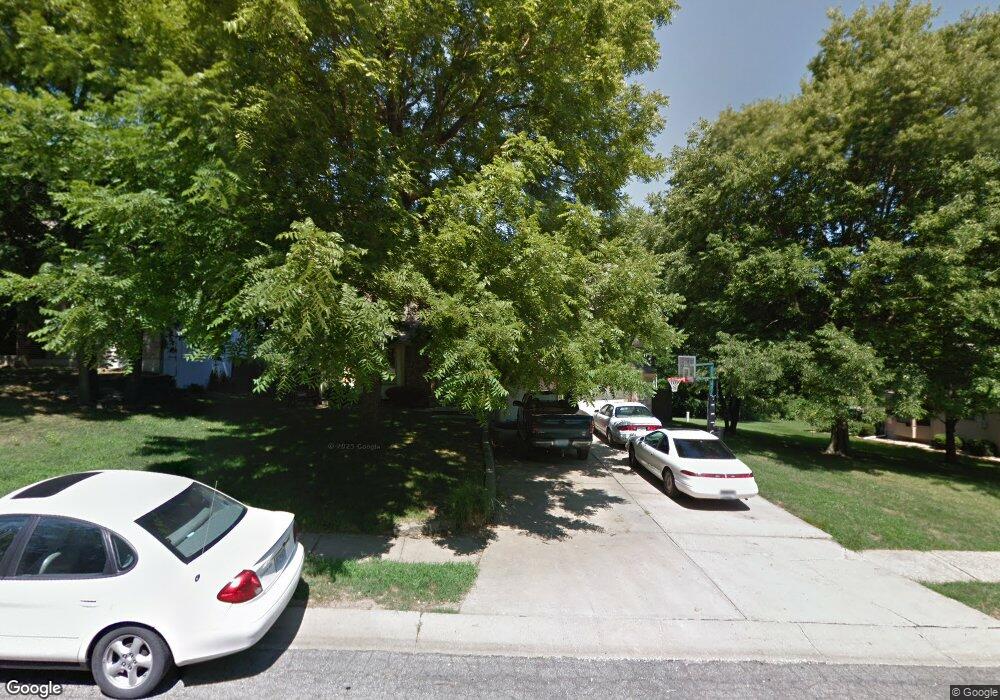
2113 N Salem Dr Independence, MO 64058
Estimated Value: $299,000 - $347,000
4
Beds
4
Baths
1,587
Sq Ft
$200/Sq Ft
Est. Value
About This Home
This home is located at 2113 N Salem Dr, Independence, MO 64058 and is currently estimated at $317,209, approximately $199 per square foot. 2113 N Salem Dr is a home located in Jackson County with nearby schools including Fort Osage High School.
Ownership History
Date
Name
Owned For
Owner Type
Purchase Details
Closed on
May 27, 2016
Sold by
Bowen Mark and Bowen Lori
Bought by
Bowen Mark and Bowen Lori
Current Estimated Value
Create a Home Valuation Report for This Property
The Home Valuation Report is an in-depth analysis detailing your home's value as well as a comparison with similar homes in the area
Purchase History
| Date | Buyer | Sale Price | Title Company |
|---|---|---|---|
| Bowen Mark | -- | Kansas City Title | |
| Bowen Mark | -- | Kansas City Title |
Source: Public Records
Tax History
| Year | Tax Paid | Tax Assessment Tax Assessment Total Assessment is a certain percentage of the fair market value that is determined by local assessors to be the total taxable value of land and additions on the property. | Land | Improvement |
|---|---|---|---|---|
| 2025 | $3,397 | $43,672 | $5,666 | $38,006 |
| 2024 | $3,366 | $37,975 | $3,264 | $34,711 |
| 2023 | $3,366 | $37,975 | $3,152 | $34,823 |
| 2022 | $3,467 | $37,050 | $4,779 | $32,271 |
| 2021 | $3,470 | $37,050 | $4,779 | $32,271 |
| 2020 | $3,291 | $34,631 | $4,779 | $29,852 |
| 2019 | $3,225 | $34,631 | $4,779 | $29,852 |
| 2018 | $2,454 | $26,243 | $2,877 | $23,366 |
| 2016 | $2,069 | $23,973 | $3,451 | $20,522 |
Source: Public Records
Map
Nearby Homes
- 19115 E Roxsbury Ln
- 2103 N York Rd
- 2006 N Plymouth Rd
- 18901 E Lynchburg Place N
- 1824 Vista Dr
- 1600 N Dover St
- 18210 E Union School Rd
- 18901 E Lexington Rd
- 2611 N Union School Rd
- 18104 E 17th St N
- 18407 E Lexington Rd
- 17805 E Union School Rd
- 1511 Osage Trail
- 1620 N Belvidere Ave
- 1607 N Belvidere Ave
- 20242 E 17th Street Ct N
- 1724 N Hanover Ave
- 19200 E 14th St N
- 19704 E 14th Terrace N
- 1328 N Holland Ct
- 2115 N Salem Dr
- 2111 N Salem Dr
- 2114 N Salem Dr
- 2112 N Salem Dr
- 2119 N Salem Dr
- 2116 N Salem Dr
- 2201 N Ponca Dr
- 2118 N Salem Dr
- 2110 N Salem Dr
- 2203 N Ponca Dr
- 2108 N Salem Dr
- 2107 N Grove Dr
- 2105 N Grove Dr
- 2203 N Salem Dr
- 2113 N Dover St
- 2204 N Ponca Dr
- 2205 N Ponca Dr
- 2115 N Dover St
- 2111 N Dover St
- 2206 N Ponca Dr
Your Personal Tour Guide
Ask me questions while you tour the home.