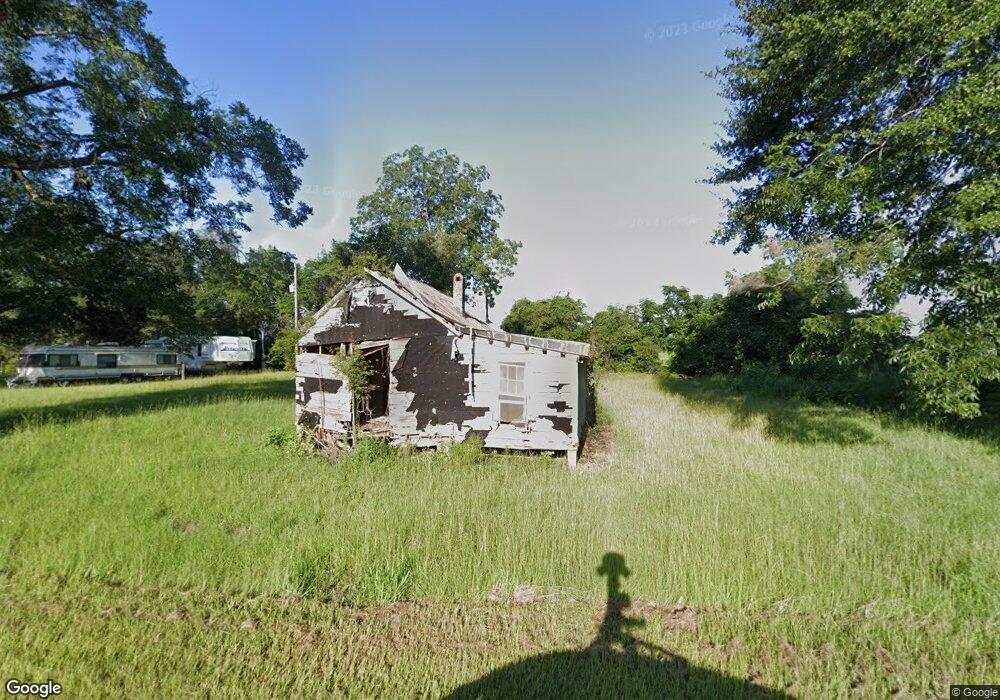
2113 Rice Rd Morgan, GA 39866
Estimated Value: $160,974 - $210,000
3
Beds
2
Baths
1,722
Sq Ft
$105/Sq Ft
Est. Value
About This Home
This home is located at 2113 Rice Rd, Morgan, GA 39866 and is currently estimated at $181,658, approximately $105 per square foot. 2113 Rice Rd is a home located in Calhoun County with nearby schools including Calhoun County Elementary School, Calhoun County Middle School, and Calhoun County High School.
Ownership History
Date
Name
Owned For
Owner Type
Purchase Details
Closed on
Aug 19, 2011
Sold by
Ford Mary Elizabeth
Bought by
Ellis Jimmy M and Ellis Tammy T
Current Estimated Value
Home Financials for this Owner
Home Financials are based on the most recent Mortgage that was taken out on this home.
Original Mortgage
$84,400
Outstanding Balance
$57,910
Interest Rate
4.53%
Mortgage Type
New Conventional
Estimated Equity
$123,748
Purchase Details
Closed on
Nov 27, 2008
Sold by
Roney Cecil Neal
Bought by
Ford Mary Elizabeth
Purchase Details
Closed on
May 24, 2007
Sold by
Cowart Ronda R
Bought by
Roney Cecil Neal and Ford Mary Elizabeth
Home Financials for this Owner
Home Financials are based on the most recent Mortgage that was taken out on this home.
Original Mortgage
$91,180
Interest Rate
6.16%
Mortgage Type
New Conventional
Create a Home Valuation Report for This Property
The Home Valuation Report is an in-depth analysis detailing your home's value as well as a comparison with similar homes in the area
Home Values in the Area
Average Home Value in this Area
Purchase History
| Date | Buyer | Sale Price | Title Company |
|---|---|---|---|
| Ellis Jimmy M | $91,258 | -- | |
| Ford Mary Elizabeth | -- | -- | |
| Roney Cecil Neal | $84,000 | -- |
Source: Public Records
Mortgage History
| Date | Status | Borrower | Loan Amount |
|---|---|---|---|
| Open | Ellis Jimmy M | $84,400 | |
| Previous Owner | Roney Cecil Neal | $91,180 |
Source: Public Records
Tax History Compared to Growth
Tax History
| Year | Tax Paid | Tax Assessment Tax Assessment Total Assessment is a certain percentage of the fair market value that is determined by local assessors to be the total taxable value of land and additions on the property. | Land | Improvement |
|---|---|---|---|---|
| 2025 | $1,135 | $35,175 | $12,891 | $22,284 |
| 2024 | $1,136 | $35,175 | $12,891 | $22,284 |
| 2023 | $1,106 | $35,175 | $12,891 | $22,284 |
| 2022 | $1,189 | $34,975 | $12,891 | $22,084 |
| 2021 | $1,171 | $33,321 | $12,891 | $20,430 |
| 2020 | $1,207 | $33,341 | $12,891 | $20,450 |
| 2019 | $1,172 | $31,362 | $12,891 | $18,471 |
| 2018 | $1,083 | $31,362 | $12,891 | $18,471 |
| 2017 | $995 | $31,362 | $12,891 | $18,471 |
| 2016 | $995 | $31,347 | $12,891 | $18,456 |
| 2015 | -- | $30,947 | $12,891 | $18,056 |
| 2014 | -- | $31,355 | $12,891 | $18,464 |
| 2013 | -- | $31,373 | $12,890 | $18,482 |
Source: Public Records
Map
Nearby Homes
- 33895 Ga-45
- 00 Hwy 41
- Cordrays Mill S
- 31 Georgia 41
- 0 Georgia 41
- William Avera Rd
- 2700 Silo Rd
- 0 Fountain Bridge Rd
- 3418 New Hope Trail
- 5227 Georgia 37
- 223 Deer Run Rd
- 203 Wayback Rd
- 0 Carver St
- 6 E Railroad St
- 1626 Pine St
- 77 Melvin St
- 464 Bay Ave NE
- 48 Cheney St
- County Line Rd Lot Unit WP001
- Pine St NW