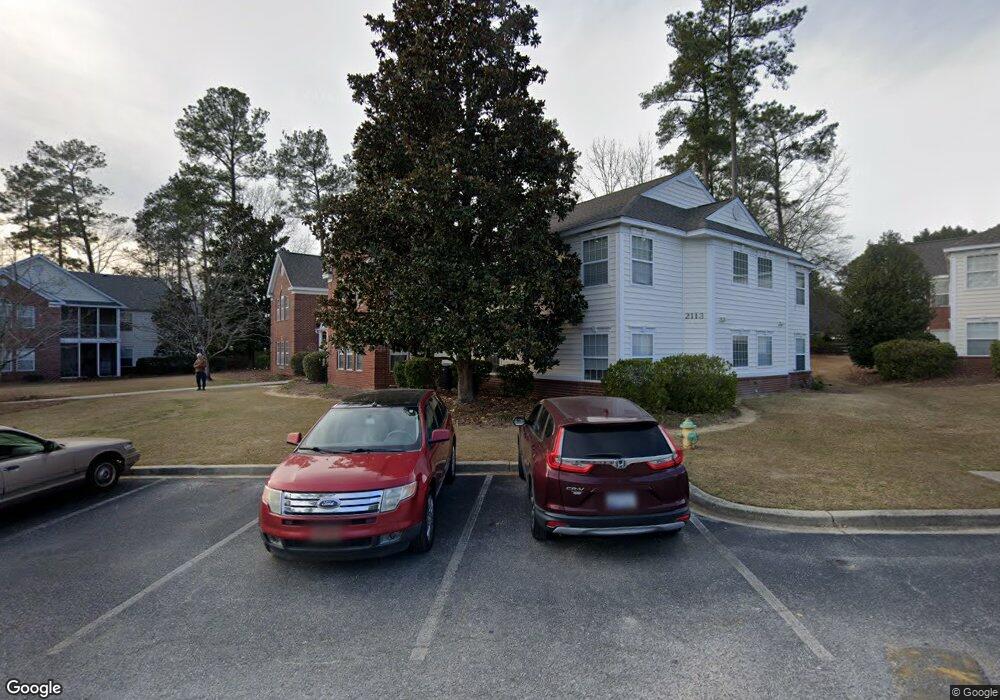
2113 Sanderling Dr Unit D Florence, SC 29505
Estimated Value: $152,000 - $161,000
3
Beds
2
Baths
1,402
Sq Ft
$111/Sq Ft
Est. Value
About This Home
This home is located at 2113 Sanderling Dr Unit D, Florence, SC 29505 and is currently estimated at $155,527, approximately $110 per square foot. 2113 Sanderling Dr Unit D is a home located in Florence County with nearby schools including McLaurin Elementary School, Southside Middle School, and South Florence High School.
Ownership History
Date
Name
Owned For
Owner Type
Purchase Details
Closed on
Aug 28, 2025
Sold by
Cockfield Amanda K
Bought by
Sandifer Wilks Leigh
Current Estimated Value
Purchase Details
Closed on
Sep 6, 2023
Sold by
Pressley Joey Bernard
Bought by
Cockfield Amanda K
Home Financials for this Owner
Home Financials are based on the most recent Mortgage that was taken out on this home.
Original Mortgage
$121,000
Interest Rate
6.81%
Mortgage Type
New Conventional
Purchase Details
Closed on
Aug 19, 2021
Sold by
Pressley Nellie L
Bought by
Pressley Joey Bernard
Purchase Details
Closed on
May 4, 2009
Sold by
Valesky Debra and Kassan Debra
Bought by
Pressley Nellie L
Purchase Details
Closed on
Oct 8, 2004
Sold by
Heath Charles Iii J Kenneth and Heath Charles Mary
Bought by
Kassan Debra L
Purchase Details
Closed on
Dec 26, 2001
Sold by
Key Charles Iii J Kenneth and Key Charles Margaret
Bought by
Charles Mary Heath
Create a Home Valuation Report for This Property
The Home Valuation Report is an in-depth analysis detailing your home's value as well as a comparison with similar homes in the area
Purchase History
| Date | Buyer | Sale Price | Title Company |
|---|---|---|---|
| Sandifer Wilks Leigh | $157,000 | None Listed On Document | |
| Cockfield Amanda K | $135,000 | None Listed On Document | |
| Pressley Joey Bernard | -- | None Available | |
| Pressley Nellie L | $105,000 | -- | |
| Kassan Debra L | $90,000 | -- | |
| Charles Mary Heath | -- | -- |
Source: Public Records
Mortgage History
| Date | Status | Borrower | Loan Amount |
|---|---|---|---|
| Previous Owner | Cockfield Amanda K | $121,000 |
Source: Public Records
Tax History
| Year | Tax Paid | Tax Assessment Tax Assessment Total Assessment is a certain percentage of the fair market value that is determined by local assessors to be the total taxable value of land and additions on the property. | Land | Improvement |
|---|---|---|---|---|
| 2025 | $680 | $5,332 | $280 | $5,052 |
| 2024 | $547 | $5,332 | $280 | $5,052 |
| 2023 | $410 | $3,836 | $280 | $3,556 |
| 2022 | $2,079 | $3,836 | $280 | $3,556 |
| 2021 | $241 | $3,840 | $0 | $0 |
| 2020 | $247 | $3,840 | $0 | $0 |
| 2019 | $233 | $3,836 | $280 | $3,556 |
| 2018 | $409 | $3,840 | $0 | $0 |
| 2017 | $388 | $3,840 | $0 | $0 |
| 2016 | $350 | $3,840 | $0 | $0 |
| 2015 | $366 | $3,840 | $0 | $0 |
| 2014 | $316 | $3,836 | $280 | $3,556 |
Source: Public Records
Map
Nearby Homes
- 2113 Sanderling Dr
- 2141 Elderberry Dr
- 1193 Waxwing Dr
- 1110 3rd Loop Rd
- 1905 Marsh Ave
- 1830 Marsh Ave
- 1860 Brigadoone Ln
- 1807 Nottingham Dr
- 2001 Elaine Cir
- 2943 Wild Turkey Dr
- 1768 Marsh Ave
- 926 3rd Loop Rd
- 922 3rd Loop Rd
- 1701 Tuxedo Junction Rd
- 2342 S Hallmark Dr
- 1804 Woods Dr
- 1717 Full Moon Rd
- 1216 Barn Owl Rd
- 1814 Citadel St
- 1815 Hampton Dr
- 2113 Sanderling Dr
- 2113 Sanderling Dr Unit E
- 2113 Sanderling Dr Unit 2113G
- 2113 Sanderling Dr Unit C
- 2113 Sanderling Dr Unit F
- 2113 Sanderling Dr Unit B
- 2109 Sanderling Dr
- 2109 Unit G Sanderling Dr
- 2109 Sanderling Dr Unit E
- 2109 Sanderling Dr Unit 2109F
- 2109 Sanderling Dr
- 2109 Sanderling Dr Unit 4
- 2109 Sanderling Dr Unit B
- 2109 Sanderling Dr Unit A
- 2109 Sanderling Dr Unit H
- 0 2109 Unit G Sanderling Dr
- 2117 Sanderling Dr Unit 2117C
- 2117 Sanderling Dr Unit 2117F
- 2117 Sanderling Dr
- 2117 Sanderling Dr Unit E
Your Personal Tour Guide
Ask me questions while you tour the home.