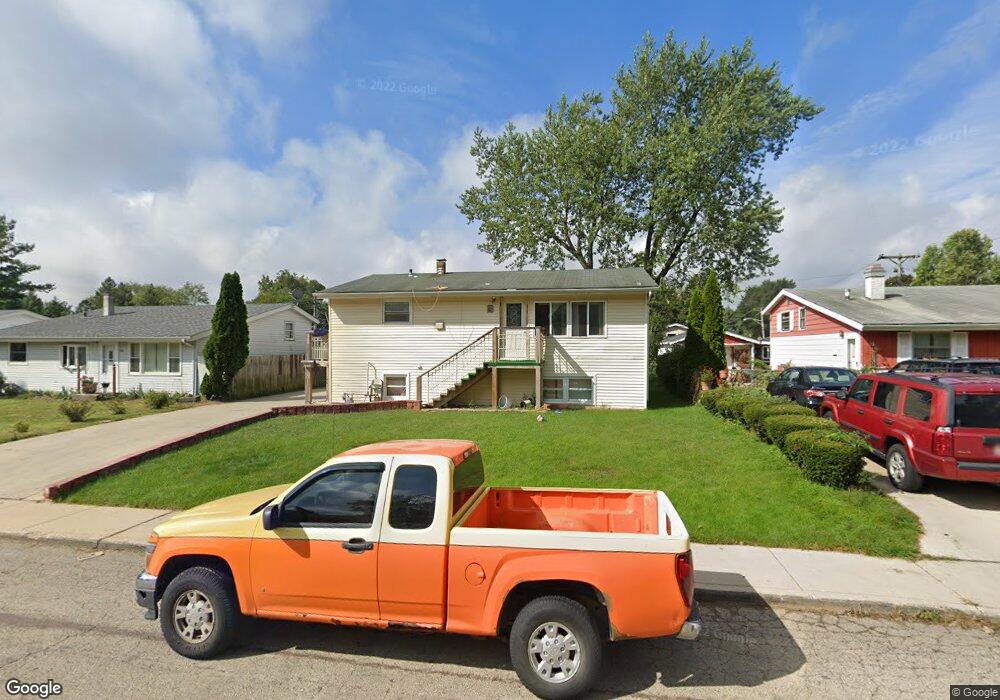
2113 Tepee Ave Carpentersville, IL 60110
Estimated Value: $277,799 - $308,000
3
Beds
--
Bath
2,072
Sq Ft
$142/Sq Ft
Est. Value
About This Home
This home is located at 2113 Tepee Ave, Carpentersville, IL 60110 and is currently estimated at $294,700, approximately $142 per square foot. 2113 Tepee Ave is a home located in Kane County with nearby schools including Sunny Hill Elementary School, Barrington Middle School Station Campus, and Barrington High School.
Ownership History
Date
Name
Owned For
Owner Type
Purchase Details
Closed on
Dec 1, 2003
Sold by
Joya Jose Armando and Joya Alejandra
Bought by
Joya Jose Armando and Joya Saya
Current Estimated Value
Purchase Details
Closed on
May 14, 1999
Sold by
Joya Raul and Joya Maria Yolana
Bought by
Joya Jose Armando and Joya Alejandra
Home Financials for this Owner
Home Financials are based on the most recent Mortgage that was taken out on this home.
Original Mortgage
$109,100
Outstanding Balance
$27,956
Interest Rate
6.94%
Mortgage Type
FHA
Estimated Equity
$266,744
Purchase Details
Closed on
Jul 14, 1995
Sold by
Joya Raul and Joya Maria Yolanda
Bought by
Joya Raul and Joya Maria Yolanda
Create a Home Valuation Report for This Property
The Home Valuation Report is an in-depth analysis detailing your home's value as well as a comparison with similar homes in the area
Home Values in the Area
Average Home Value in this Area
Purchase History
| Date | Buyer | Sale Price | Title Company |
|---|---|---|---|
| Joya Jose Armando | -- | Amerititle Inc | |
| Joya Jose Armando | $110,000 | First American Title Ins Co | |
| Joya Raul | -- | -- |
Source: Public Records
Mortgage History
| Date | Status | Borrower | Loan Amount |
|---|---|---|---|
| Open | Joya Jose Armando | $109,100 |
Source: Public Records
Tax History Compared to Growth
Tax History
| Year | Tax Paid | Tax Assessment Tax Assessment Total Assessment is a certain percentage of the fair market value that is determined by local assessors to be the total taxable value of land and additions on the property. | Land | Improvement |
|---|---|---|---|---|
| 2024 | $5,442 | $78,418 | $12,553 | $65,865 |
| 2023 | $5,171 | $70,558 | $11,295 | $59,263 |
| 2022 | $4,880 | $62,811 | $11,295 | $51,516 |
| 2021 | $4,682 | $59,306 | $10,665 | $48,641 |
| 2020 | $4,460 | $57,972 | $10,425 | $47,547 |
| 2019 | $4,203 | $55,034 | $9,897 | $45,137 |
| 2018 | $4,041 | $51,153 | $9,701 | $41,452 |
| 2017 | $3,744 | $47,851 | $9,075 | $38,776 |
| 2016 | $3,353 | $41,663 | $8,787 | $32,876 |
| 2015 | -- | $35,409 | $8,234 | $27,175 |
| 2014 | -- | $31,601 | $8,007 | $23,594 |
| 2013 | -- | $32,568 | $8,252 | $24,316 |
Source: Public Records
Map
Nearby Homes
- 140 Hickory Dr
- 336 Delaware St
- 103 Hickory Dr
- 1426 Kings Rd
- 944 Cortney Dr
- 105 Siesta Rd
- 1811 IL Rte 25 (Elgin) Rd
- 200 Amarillo Dr
- 2013 Silverstone Dr Unit 2013
- 7 Autumn Trail
- 308 Amarillo Ct
- 57 Robin Rd
- 1431 Silverstone Dr Unit 1416
- 2245 Flagstone Ln Unit 155
- 94 Wren Rd
- 155 Helm Rd
- 713 Silverstone Dr Unit 77
- 1309 Silverstone Dr Unit 1305
- 1303 Silverstone Dr Unit 1302
- 7 Austin Ave
- 2115 Tepee Ave Unit 5
- 2111 Tepee Ave Unit 5
- 2312 Arrow St Unit 5
- 2314 Arrow St
- 2310 Arrow St
- 2117 Tepee Ave
- 2109 Tepee Ave Unit 5
- 2112 Tepee Ave
- 2114 Tepee Ave
- 2316 Arrow St
- 2308 Arrow St
- 2110 Tepee Ave
- 2119 Tepee Ave
- 2107 Tepee Ave
- 2116 Tepee Ave Unit 5
- 2108 Tepee Ave
- 2318 Arrow St
- 2306 Arrow St
- 2118 Tepee Ave Unit 5
- 2121 Tepee Ave