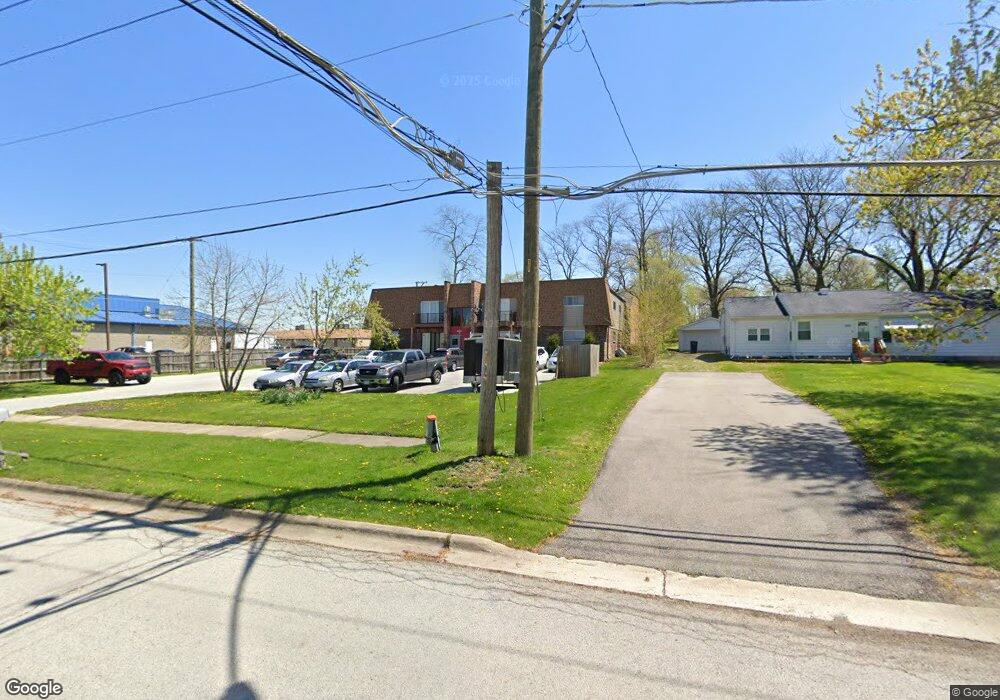
21133 Kildare Ave Unit 1A Matteson, IL 60443
Old Matteson NeighborhoodEstimated Value: $328,000 - $804,000
4
Beds
4
Baths
7,512
Sq Ft
$77/Sq Ft
Est. Value
About This Home
This home is located at 21133 Kildare Ave Unit 1A, Matteson, IL 60443 and is currently estimated at $576,000, approximately $76 per square foot. 21133 Kildare Ave Unit 1A is a home located in Cook County with nearby schools including Illinois School, Matteson Elementary School, and Sauk Elementary School.
Ownership History
Date
Name
Owned For
Owner Type
Purchase Details
Closed on
Jan 24, 2024
Sold by
2330 182Nd Place Llc
Bought by
Wenus Properties Ltd
Current Estimated Value
Home Financials for this Owner
Home Financials are based on the most recent Mortgage that was taken out on this home.
Original Mortgage
$480,000
Outstanding Balance
$471,129
Interest Rate
6.66%
Mortgage Type
Credit Line Revolving
Estimated Equity
$104,871
Purchase Details
Closed on
Dec 20, 2018
Sold by
Monty Titling Trust 1
Bought by
2330 182Nd Place Llc
Home Financials for this Owner
Home Financials are based on the most recent Mortgage that was taken out on this home.
Original Mortgage
$221,250
Interest Rate
4.8%
Mortgage Type
Commercial
Purchase Details
Closed on
Jan 4, 2005
Sold by
Lasalle Bank Na
Bought by
Harris Bank & Trust and Trust #113383
Create a Home Valuation Report for This Property
The Home Valuation Report is an in-depth analysis detailing your home's value as well as a comparison with similar homes in the area
Home Values in the Area
Average Home Value in this Area
Purchase History
| Date | Buyer | Sale Price | Title Company |
|---|---|---|---|
| Wenus Properties Ltd | $625,000 | Chicago Title | |
| 2330 182Nd Place Llc | $300,000 | Fidelity National Title | |
| Harris Bank & Trust | $187,000 | Lawyers |
Source: Public Records
Mortgage History
| Date | Status | Borrower | Loan Amount |
|---|---|---|---|
| Open | Wenus Properties Ltd | $480,000 | |
| Previous Owner | 2330 182Nd Place Llc | $221,250 |
Source: Public Records
Tax History Compared to Growth
Tax History
| Year | Tax Paid | Tax Assessment Tax Assessment Total Assessment is a certain percentage of the fair market value that is determined by local assessors to be the total taxable value of land and additions on the property. | Land | Improvement |
|---|---|---|---|---|
| 2024 | $2,740 | $6,630 | $843 | $5,787 |
| 2023 | $2,216 | $6,630 | $843 | $5,787 |
| 2022 | $2,216 | $4,087 | $948 | $3,139 |
| 2021 | $2,247 | $4,085 | $947 | $3,138 |
| 2020 | $2,081 | $4,085 | $947 | $3,138 |
| 2019 | $2,102 | $4,062 | $842 | $3,220 |
| 2018 | $2,311 | $4,466 | $842 | $3,624 |
| 2017 | $2,219 | $4,466 | $842 | $3,624 |
| 2016 | $1,934 | $3,934 | $737 | $3,197 |
| 2015 | $2,271 | $4,658 | $737 | $3,921 |
| 2014 | $2,199 | $4,658 | $737 | $3,921 |
| 2013 | $1,297 | $3,006 | $737 | $2,269 |
Source: Public Records
Map
Nearby Homes
- 21130 Kildare Ave
- 4200 Washington Ave
- 4335 Lindenwood Dr
- 4329 Applewood Ln
- 4108 Applewood Ln
- 831 Violet Ln
- 748 Kostner Ave
- 807 Violet Ln
- 4608 Lindenwood Ct
- 820 Exmoor Rd
- 706 Carnation Ln
- 3718 211th Place
- 3865 216th St
- 663 Primrose Ln
- 3809 215th St
- 21142 Locust St
- 3711 213th Place
- 3638 213th St
- 3712 214th St
- 3727 214th Place Unit 2
- 21133 Kildare Ave
- 21133 Kildare Ave Unit 1B
- 21133 Kildare Ave Unit 2C
- 21133 Kildare Ave Unit 1A
- 21137 Kildare Ave
- 21141 Kildare Ave
- 4249 Lincoln Hwy
- 21120 Kildare Ave
- 21147 Kildare Ave
- 21140 Kildare Ave
- 21151 Kildare Ave
- 4233 Lincoln Hwy
- 4318 Kildare Ct
- 4331 Lincoln Hwy
- 4331 211th St
- 21153 Kildare Ave
- 4322 Kildare Ct
- 21155 Kildare Ave
- 4323 Kildare Ct
- 4338 Kildare Ct