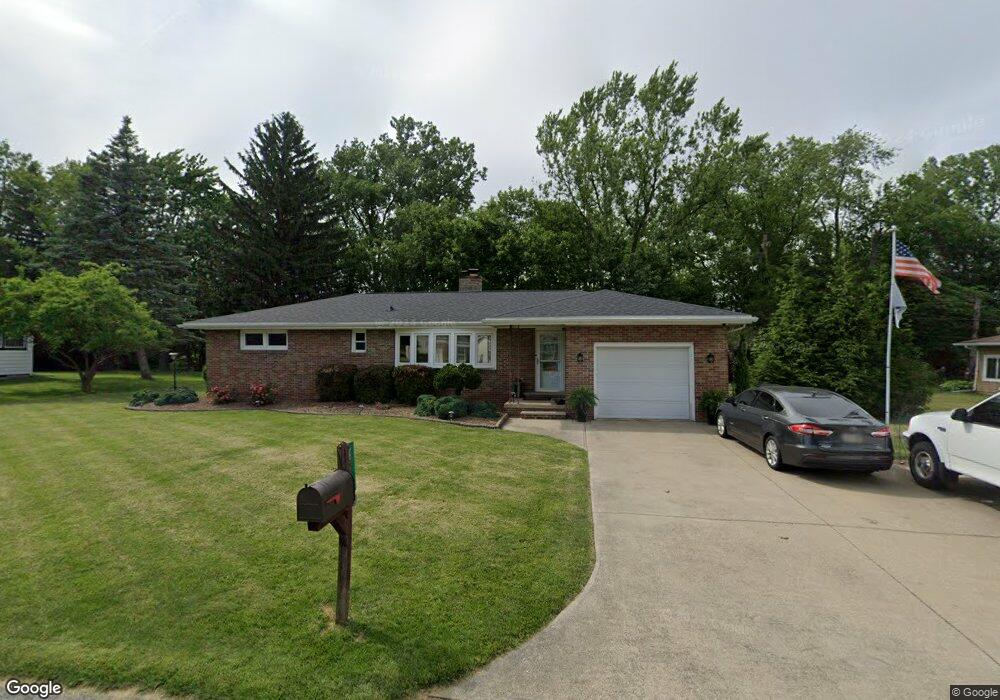
2114 Elm Dr Fremont, OH 43420
Estimated Value: $173,000 - $201,576
3
Beds
1
Bath
1,268
Sq Ft
$149/Sq Ft
Est. Value
About This Home
This home is located at 2114 Elm Dr, Fremont, OH 43420 and is currently estimated at $188,644, approximately $148 per square foot. 2114 Elm Dr is a home located in Sandusky County with nearby schools including Fremont Ross High School, St. Joseph School, and Bishop Hoffman Catholic School - This is St Joe's School now.
Ownership History
Date
Name
Owned For
Owner Type
Purchase Details
Closed on
Mar 14, 2003
Sold by
Messina Thomas A
Bought by
Frost Kenneth P and Frost Julie A
Current Estimated Value
Home Financials for this Owner
Home Financials are based on the most recent Mortgage that was taken out on this home.
Original Mortgage
$119,300
Interest Rate
6%
Mortgage Type
Purchase Money Mortgage
Purchase Details
Closed on
May 10, 1999
Sold by
Morgan Judith K
Bought by
Messina Thomas A
Home Financials for this Owner
Home Financials are based on the most recent Mortgage that was taken out on this home.
Original Mortgage
$95,000
Interest Rate
7.04%
Mortgage Type
New Conventional
Purchase Details
Closed on
Jul 1, 1992
Sold by
Frost Kenneth P and Frost Julie
Bought by
Frost Kenneth P and Frost Julie A
Purchase Details
Closed on
Jan 1, 1984
Bought by
Frost Kenneth P and Frost Julie A
Create a Home Valuation Report for This Property
The Home Valuation Report is an in-depth analysis detailing your home's value as well as a comparison with similar homes in the area
Home Values in the Area
Average Home Value in this Area
Purchase History
| Date | Buyer | Sale Price | Title Company |
|---|---|---|---|
| Frost Kenneth P | $92,250 | Multiple | |
| Messina Thomas A | $115,000 | -- | |
| Frost Kenneth P | $85,500 | -- | |
| Frost Kenneth P | $60,000 | -- |
Source: Public Records
Mortgage History
| Date | Status | Borrower | Loan Amount |
|---|---|---|---|
| Previous Owner | Frost Kenneth P | $119,300 | |
| Previous Owner | Messina Thomas A | $95,000 |
Source: Public Records
Tax History Compared to Growth
Tax History
| Year | Tax Paid | Tax Assessment Tax Assessment Total Assessment is a certain percentage of the fair market value that is determined by local assessors to be the total taxable value of land and additions on the property. | Land | Improvement |
|---|---|---|---|---|
| 2024 | $2,186 | $56,250 | $11,130 | $45,120 |
| 2023 | $2,186 | $48,090 | $9,520 | $38,570 |
| 2022 | $1,996 | $48,090 | $9,520 | $38,570 |
| 2021 | $2,057 | $48,090 | $9,520 | $38,570 |
| 2020 | $1,728 | $39,620 | $9,520 | $30,100 |
| 2019 | $1,726 | $39,620 | $9,520 | $30,100 |
| 2018 | $1,601 | $39,620 | $9,520 | $30,100 |
| 2017 | $1,522 | $35,700 | $9,520 | $26,180 |
| 2016 | $1,334 | $35,700 | $9,520 | $26,180 |
| 2015 | $1,312 | $35,700 | $9,520 | $26,180 |
| 2014 | $1,413 | $36,820 | $9,240 | $27,580 |
| 2013 | $1,383 | $36,820 | $9,240 | $27,580 |
Source: Public Records
Map
Nearby Homes
- 2484 Buckland Ave
- 1719 Buckland Ave
- 1485 Autumn Woods Dr
- 1420 Center St
- 1611 Mcpherson Blvd
- 10 Meadowbrook Dr
- 10 Meadowbrook Ln
- 515 Everett Rd
- 64 River Run Dr Unit J
- 1028 June St
- 1013 Whittlesey St
- 2119 Lake St
- 905 Twinn St
- 1015 Hayes Ave
- 1037 Buckland Ave
- 815 South St
- 616 S Wood St
- 135 Briarwood Cir
- 625 Bush Place
- 1009 Napoleon St