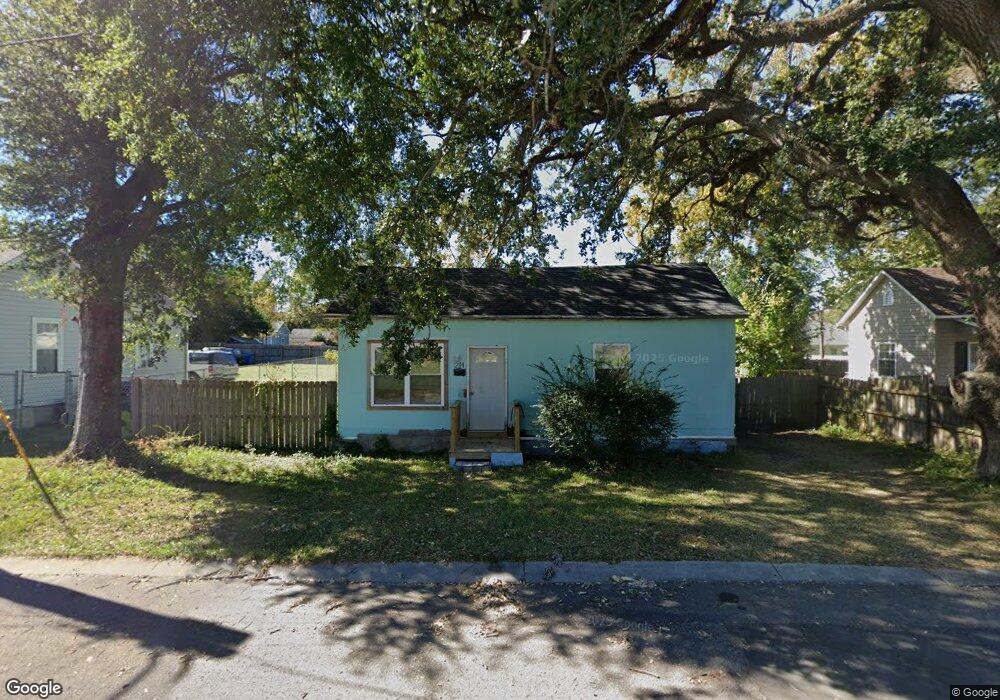
2114 Fowler St Wilmington, NC 28403
Carolina Place NeighborhoodEstimated Value: $149,000 - $371,000
2
Beds
1
Bath
876
Sq Ft
$277/Sq Ft
Est. Value
About This Home
This home is located at 2114 Fowler St, Wilmington, NC 28403 and is currently estimated at $242,759, approximately $277 per square foot. 2114 Fowler St is a home located in New Hanover County with nearby schools including Forest Hills Global Elementary School, Williston Middle School, and John T. Hoggard High School.
Ownership History
Date
Name
Owned For
Owner Type
Purchase Details
Closed on
Feb 13, 2004
Sold by
North Carolina Realty
Bought by
Cannone Salvatore
Current Estimated Value
Purchase Details
Closed on
Jul 27, 2000
Sold by
Maddrey Joseph G Sub Trustee
Bought by
North Carolina Realty
Purchase Details
Closed on
Mar 5, 1997
Sold by
Coats Pamela S James E
Bought by
Bannerman Betty J
Purchase Details
Closed on
May 25, 1995
Sold by
Mcintyre Jeffrey B
Bought by
Coats James E Pamela S
Purchase Details
Closed on
Aug 17, 1994
Sold by
Coats James E Pamela S
Bought by
Mcintyre Jeffrey B
Purchase Details
Closed on
Mar 15, 1994
Sold by
Jewell Kelly W Iv Julia W
Bought by
Coats James E Pamela S
Purchase Details
Closed on
Dec 1, 1988
Sold by
Carolina Delta Corp
Bought by
Jewell Kelly W
Purchase Details
Closed on
Dec 1, 1984
Sold by
Davis Jr John K
Bought by
Carolina Delta Corp
Purchase Details
Closed on
Oct 1, 1977
Bought by
Davis John K
Create a Home Valuation Report for This Property
The Home Valuation Report is an in-depth analysis detailing your home's value as well as a comparison with similar homes in the area
Home Values in the Area
Average Home Value in this Area
Purchase History
| Date | Buyer | Sale Price | Title Company |
|---|---|---|---|
| Cannone Salvatore | $44,000 | -- | |
| North Carolina Realty | $24,500 | -- | |
| Bannerman Betty J | $25,000 | -- | |
| Coats James E Pamela S | $19,000 | -- | |
| Mcintyre Jeffrey B | $20,000 | -- | |
| Coats James E Pamela S | $32,000 | -- | |
| Jewell Kelly W | -- | -- | |
| Carolina Delta Corp | $16,000 | -- | |
| Davis John K | $3,000 | -- |
Source: Public Records
Tax History Compared to Growth
Tax History
| Year | Tax Paid | Tax Assessment Tax Assessment Total Assessment is a certain percentage of the fair market value that is determined by local assessors to be the total taxable value of land and additions on the property. | Land | Improvement |
|---|---|---|---|---|
| 2025 | $393 | $133,600 | $90,500 | $43,100 |
| 2023 | $409 | $94,000 | $39,800 | $54,200 |
| 2022 | $400 | $94,000 | $39,800 | $54,200 |
| 2021 | $402 | $94,000 | $39,800 | $54,200 |
| 2020 | $830 | $78,800 | $30,400 | $48,400 |
| 2019 | $830 | $78,800 | $30,400 | $48,400 |
| 2018 | $830 | $78,800 | $30,400 | $48,400 |
| 2017 | $830 | $78,800 | $30,400 | $48,400 |
| 2016 | $883 | $79,700 | $29,500 | $50,200 |
| 2015 | $635 | $60,000 | $29,500 | $30,500 |
| 2014 | $608 | $60,000 | $29,500 | $30,500 |
Source: Public Records
Map
Nearby Homes
- 2220 Gibson Ave
- 2105 Gibson Ave
- 1941 Hudson Dr
- 2119 Metts Ave
- 1933 Hudson Dr
- 2009 Metts Ave
- 1914 Nun St
- 1912 Nun St
- 1812 Nun St
- 418 Forest Hills Dr
- 2323 Wrightsville Ave
- 2208 Carlton Ave
- 1911 Lingo St
- 2304 Wrightsville Ave Unit 206
- 1812 Orange St
- 2024 Market St
- 115 Forest Hills Dr
- 6 Keaton Ave
- 1217 Spofford Cir
- 1218 Hill St
- 2118 Fowler St
- 2106 Fowler St
- 2113 Dexter St
- 2122 Fowler St
- 2109 Dexter St
- 2107 Dexter St
- 2105 Fowler St
- 2121 Dexter St
- 2126 Fowler St
- 2105 Dexter St
- 2109 Fowler St
- 2125 Dexter St
- 2101 Dexter St
- 4752 Shsq B1
- 508 S 22nd St
- 2125 Fowler St
- 2206 Gibson Ave
- 2202 Gibson Ave
- 2204 Gibson Ave
- 2208 Gibson Ave