H
Landlord's Agent in 2024
HYUN YANG
Heritage GA. Realty
(404) 993-4521
2 Total Sales
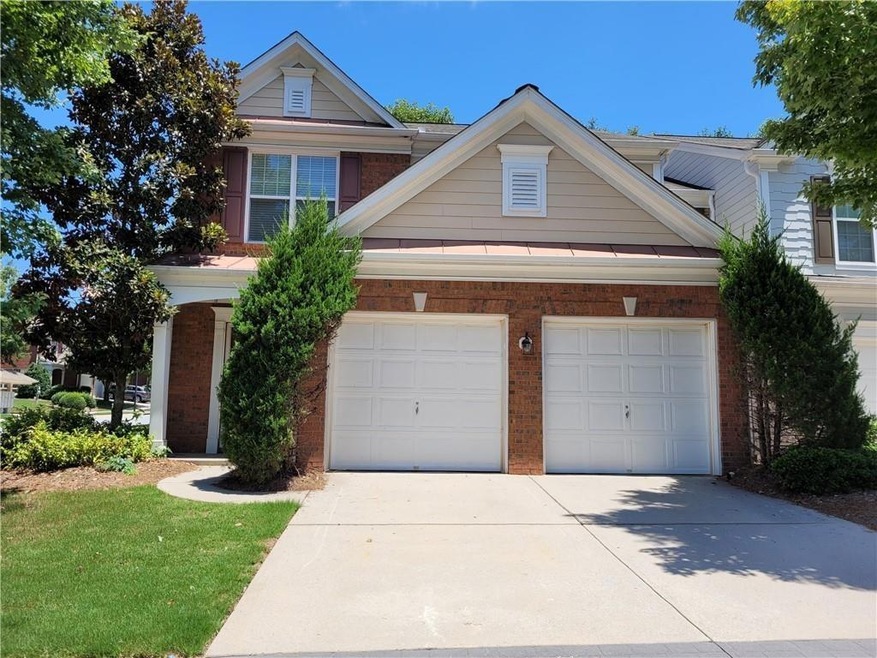
Estimated Value: $368,000 - $404,000
Updated PAINT/ LAMINATE/ CARPET/ APPLIANCES.
| Date | Buyer | Sale Price | Title Company |
|---|---|---|---|
| Yang Ji A | -- | -- | |
| Yang Hyun G | $131,000 | -- | |
| Sharp Darren M | $220,500 | -- |
| Date | Status | Borrower | Loan Amount |
|---|---|---|---|
| Previous Owner | Sharp Darren M | $33,065 | |
| Previous Owner | Sharp Darren M | $176,348 |
| Date | Event | Price | List to Sale | Price per Sq Ft |
|---|---|---|---|---|
| 09/27/2024 09/27/24 | Rented | $2,100 | -4.5% | -- |
| 09/21/2024 09/21/24 | Under Contract | -- | -- | -- |
| 09/14/2024 09/14/24 | For Rent | $2,200 | +4.8% | -- |
| 08/19/2022 08/19/22 | Rented | $2,100 | 0.0% | -- |
| 07/29/2022 07/29/22 | Under Contract | -- | -- | -- |
| 07/23/2022 07/23/22 | For Rent | $2,100 | +44.8% | -- |
| 03/18/2016 03/18/16 | Rented | $1,450 | 0.0% | -- |
| 03/07/2016 03/07/16 | For Rent | $1,450 | 0.0% | -- |
| 03/07/2016 03/07/16 | Under Contract | -- | -- | -- |
| 03/01/2016 03/01/16 | For Rent | $1,450 | +11.5% | -- |
| 02/23/2013 02/23/13 | Rented | $1,300 | 0.0% | -- |
| 02/23/2013 02/23/13 | For Rent | $1,300 | -- | -- |
| Year | Tax Paid | Tax Assessment Tax Assessment Total Assessment is a certain percentage of the fair market value that is determined by local assessors to be the total taxable value of land and additions on the property. | Land | Improvement |
|---|---|---|---|---|
| 2025 | $1,175 | $172,560 | $22,120 | $150,440 |
| 2024 | $4,484 | $151,400 | $21,200 | $130,200 |
| 2023 | $4,484 | $148,280 | $21,200 | $127,080 |
| 2022 | $4,375 | $136,280 | $18,000 | $118,280 |
| 2021 | $3,361 | $102,480 | $18,000 | $84,480 |
| 2020 | $3,244 | $98,160 | $14,400 | $83,760 |
| 2019 | $3,909 | $98,160 | $14,400 | $83,760 |
| 2018 | $2,870 | $86,680 | $14,400 | $72,280 |
| 2016 | $2,406 | $72,760 | $12,000 | $60,760 |
| 2015 | $2,590 | $65,200 | $12,000 | $53,200 |
| 2014 | -- | $52,400 | $11,000 | $41,400 |
H
Landlord's Agent in 2024
HYUN YANG
Heritage GA. Realty
(404) 993-4521
2 Total Sales
P
Tenant's Agent in 2024
Pushpraj Verma
Virtual Properties Realty.BIZ
(404) 984-8901
3 in this area
8 Total Sales
J
Buyer's Agent in 2022
Jinny Kim
The Promise Realty Group, LLC
(706) 531-8696
6 Total Sales

Seller's Agent in 2016
Grace Yoon
Virtual Properties Realty.com
(404) 514-1000
24 in this area
101 Total Sales
Buyer's Agent in 2016
Elizabeth Camp
RE/MAX
(770) 355-7163
33 Total Sales
Seller's Agent in 2013
Angela Seo
Heritage GA. Realty
(678) 549-5878
21 in this area
58 Total Sales
Source: First Multiple Listing Service (FMLS)
MLS Number: 7456062
APN: 7-199-365
Disclaimer: Certain information contained herein is derived from information provided by parties other than Homes.com. All information provided is deemed reliable, but is not guaranteed to be accurate and should be independently verified.
![]() Listings identified with the FMLS IDX logo come from FMLS and are held by brokerage firms other than the owner of this website. The listing brokerage is identified in any listing details. Information is deemed reliable but is not guaranteed. If you believe any FMLS listing contains material that infringes your copyrighted work please visit www.fmls.com/dmca to review our DMCA policy and learn how to submit a takedown request. © 2025 First Multiple Listing Service, Inc.
Listings identified with the FMLS IDX logo come from FMLS and are held by brokerage firms other than the owner of this website. The listing brokerage is identified in any listing details. Information is deemed reliable but is not guaranteed. If you believe any FMLS listing contains material that infringes your copyrighted work please visit www.fmls.com/dmca to review our DMCA policy and learn how to submit a takedown request. © 2025 First Multiple Listing Service, Inc.