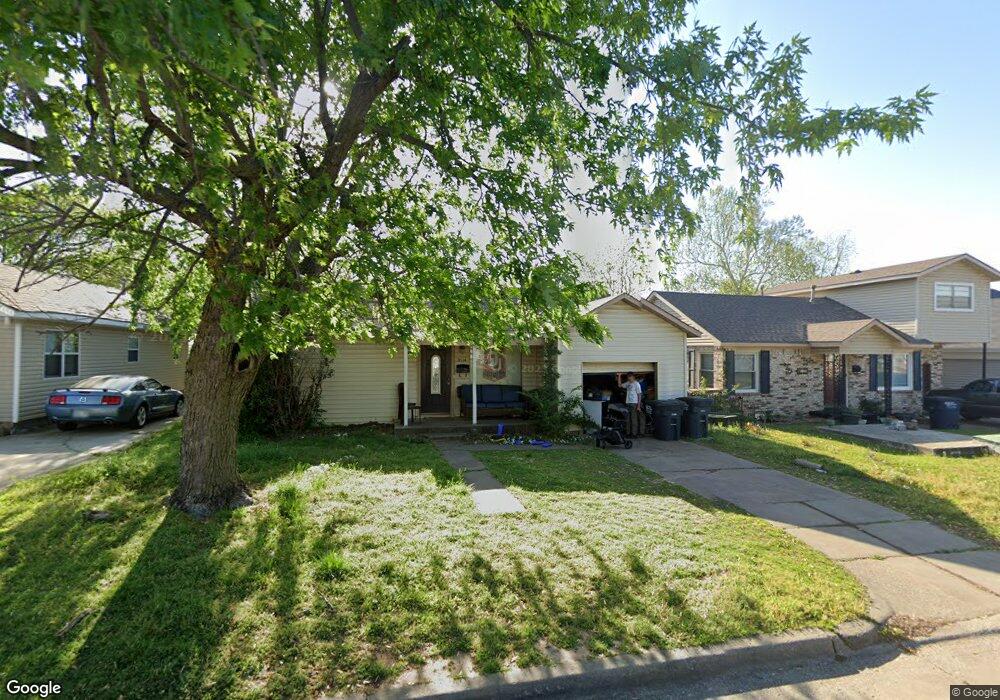
2114 N Chapman Ave Shawnee, OK 74804
Estimated Value: $81,000 - $119,000
--
Bed
1
Bath
828
Sq Ft
$112/Sq Ft
Est. Value
About This Home
This home is located at 2114 N Chapman Ave, Shawnee, OK 74804 and is currently estimated at $92,919, approximately $112 per square foot. 2114 N Chapman Ave is a home located in Pottawatomie County with nearby schools including Jefferson Elementary School, Shawnee Middle School, and Shawnee High School.
Ownership History
Date
Name
Owned For
Owner Type
Purchase Details
Closed on
Mar 20, 2014
Sold by
Hsbc Bank Usa Na
Bought by
Bruce Cantrell Properties Llc
Current Estimated Value
Purchase Details
Closed on
Nov 5, 2013
Sold by
Bishop Carl and Case #Cj-2011-677
Bought by
Hsbc Bank Usa Na
Purchase Details
Closed on
Feb 9, 2007
Sold by
Dagiva Enterprises Inc
Bought by
Bishop Carl
Home Financials for this Owner
Home Financials are based on the most recent Mortgage that was taken out on this home.
Original Mortgage
$57,800
Interest Rate
6.13%
Mortgage Type
Purchase Money Mortgage
Purchase Details
Closed on
Aug 4, 2006
Sold by
Westerman Wanda and Westerman Denis
Bought by
Dagiva Enterprises Inc
Home Financials for this Owner
Home Financials are based on the most recent Mortgage that was taken out on this home.
Original Mortgage
$41,300
Interest Rate
6.66%
Mortgage Type
Purchase Money Mortgage
Create a Home Valuation Report for This Property
The Home Valuation Report is an in-depth analysis detailing your home's value as well as a comparison with similar homes in the area
Home Values in the Area
Average Home Value in this Area
Purchase History
| Date | Buyer | Sale Price | Title Company |
|---|---|---|---|
| Bruce Cantrell Properties Llc | $30,000 | Stewart Abstract & Title | |
| Hsbc Bank Usa Na | -- | None Available | |
| Bishop Carl | $68,000 | None Available | |
| Dagiva Enterprises Inc | $22,500 | None Available |
Source: Public Records
Mortgage History
| Date | Status | Borrower | Loan Amount |
|---|---|---|---|
| Previous Owner | Bishop Carl | $57,800 | |
| Previous Owner | Dagiva Enterprises Inc | $41,300 |
Source: Public Records
Tax History Compared to Growth
Tax History
| Year | Tax Paid | Tax Assessment Tax Assessment Total Assessment is a certain percentage of the fair market value that is determined by local assessors to be the total taxable value of land and additions on the property. | Land | Improvement |
|---|---|---|---|---|
| 2024 | $640 | $7,122 | $780 | $6,342 |
| 2023 | $640 | $7,122 | $780 | $6,342 |
| 2022 | $628 | $7,122 | $780 | $6,342 |
| 2021 | $617 | $7,122 | $780 | $6,342 |
| 2020 | $620 | $7,137 | $780 | $6,357 |
| 2019 | $666 | $7,381 | $780 | $6,601 |
| 2018 | $648 | $7,331 | $780 | $6,551 |
| 2017 | $660 | $7,545 | $900 | $6,645 |
| 2016 | $666 | $7,530 | $900 | $6,630 |
| 2015 | $676 | $7,755 | $900 | $6,855 |
| 2014 | $721 | $8,212 | $900 | $7,312 |
Source: Public Records
Map
Nearby Homes
- 2106 N Aydelotte Ave
- 202 W Franklin St
- 1925 N Park Ave
- 1834 N Market Ave
- 10 W Midland St
- 1710 N Park Ave
- 2021 N Broadway Ave
- 1817 N Bell Ave
- 1901 N Bell Ave
- 9 E Chicago St
- 1816 N Bell Ave
- 1607 N Beard Ave
- 1324 N Park Ave
- 1822 N Philadelphia Ave
- 210 E Cammack
- 1510 N Union Ave
- 1217 N Market Ave
- 2415 N Minnesota Cir
- 1012 N Chapman Ave
- 2304 N Tucker Ave
- 2116 N Chapman Ave
- 2110 N Chapman Ave
- 2118 N Chapman Ave
- 2102 N Chapman Ave
- 2120 N Chapman Ave
- 2105 N Pottenger Ave
- 721 W Franklin St
- 2107 N Chapman Ave
- 2109 N Pottenger Ave
- 2117 N Chapman Ave
- 2103 N Chapman Ave
- 621 W Rosa St
- 725 W Franklin St
- 635 W Franklin St
- 703 W Rosa St
- 2015 N Pottenger Ave
- 639 W Rosa St
- 2202 N Chapman Ave
- 625 W Rosa St
- 2011 N Pottenger Ave