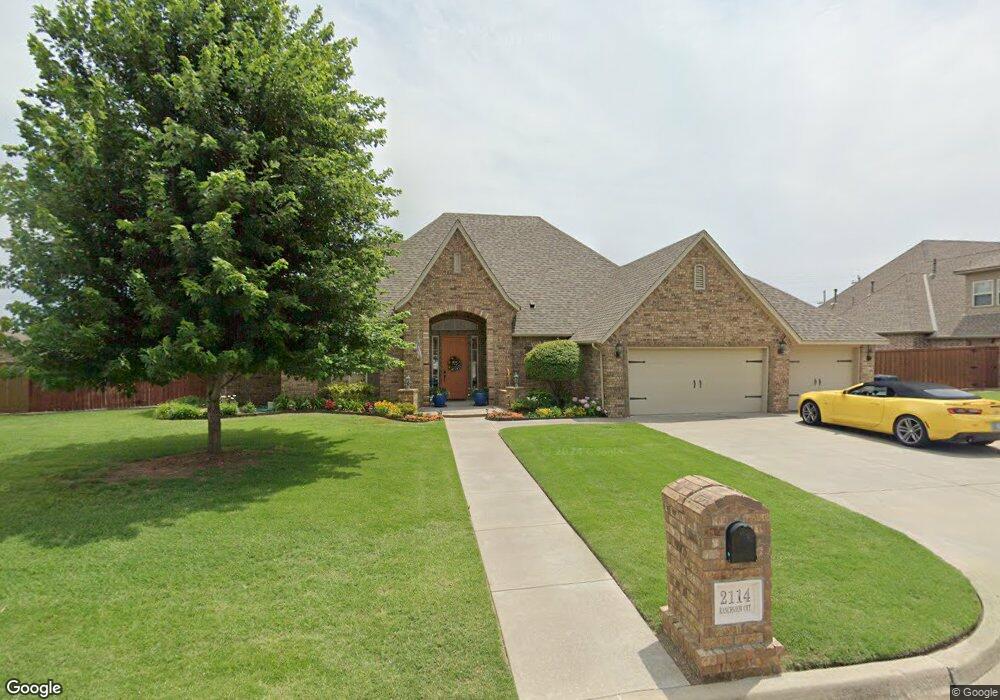
2114 Ranchview Ct Duncan, OK 73533
Estimated Value: $302,000 - $418,000
3
Beds
2
Baths
2,162
Sq Ft
$172/Sq Ft
Est. Value
About This Home
This home is located at 2114 Ranchview Ct, Duncan, OK 73533 and is currently estimated at $371,181, approximately $171 per square foot. 2114 Ranchview Ct is a home with nearby schools including Plato Elementary School, Duncan Middle School, and Duncan High School.
Ownership History
Date
Name
Owned For
Owner Type
Purchase Details
Closed on
Feb 28, 2025
Sold by
Allen and Allen Geraldine Mcguire
Bought by
Headley Rodney and Headley Darlene
Current Estimated Value
Purchase Details
Closed on
Jun 2, 2017
Sold by
Mcguire Allen and Mcguire Geraldine
Bought by
Mcguire Allen Oden and Meguire Geraldine
Purchase Details
Closed on
May 14, 2014
Sold by
Churchman Mickey T and Churchman Amanda S
Bought by
Mcguire Allen and Mcguire Geraldine M
Purchase Details
Closed on
Apr 27, 2012
Sold by
Jk Mccord Llc
Bought by
Churchman Mickey T and Churchman Amanda S
Home Financials for this Owner
Home Financials are based on the most recent Mortgage that was taken out on this home.
Original Mortgage
$252,434
Interest Rate
3.87%
Mortgage Type
FHA
Create a Home Valuation Report for This Property
The Home Valuation Report is an in-depth analysis detailing your home's value as well as a comparison with similar homes in the area
Purchase History
| Date | Buyer | Sale Price | Title Company |
|---|---|---|---|
| Headley Rodney | $365,000 | None Listed On Document | |
| Headley Rodney | $365,000 | None Listed On Document | |
| Mcguire Allen Oden | -- | None Available | |
| Mcguire Allen | $270,000 | None Available | |
| Churchman Mickey T | -- | None Available |
Source: Public Records
Mortgage History
| Date | Status | Borrower | Loan Amount |
|---|---|---|---|
| Previous Owner | Churchman Mickey T | $252,434 |
Source: Public Records
Tax History
| Year | Tax Paid | Tax Assessment Tax Assessment Total Assessment is a certain percentage of the fair market value that is determined by local assessors to be the total taxable value of land and additions on the property. | Land | Improvement |
|---|---|---|---|---|
| 2025 | $2,955 | $36,029 | $4,070 | $31,959 |
| 2024 | $2,975 | $35,931 | $4,070 | $31,861 |
| 2023 | $2,975 | $35,087 | $4,070 | $31,017 |
| 2022 | $2,794 | $34,884 | $4,070 | $30,814 |
| 2021 | $2,721 | $32,952 | $4,070 | $28,882 |
| 2020 | $2,670 | $31,924 | $4,070 | $27,854 |
| 2019 | $2,595 | $30,994 | $4,070 | $26,924 |
| 2018 | $2,671 | $30,994 | $4,070 | $26,924 |
| 2017 | $2,546 | $30,900 | $4,070 | $26,830 |
| 2016 | $2,443 | $29,738 | $4,070 | $25,668 |
| 2015 | $308 | $29,738 | $4,070 | $25,668 |
| 2014 | $308 | $28,026 | $3,749 | $24,277 |
Source: Public Records
Map
Nearby Homes
- 3990 N Ridgeview Dr
- 3885 N Ridgeview Dr
- NO ADDRESS W Plato Rd
- 2021 Overland Dr
- 2024 N Woodrock Dr
- 2001 Kingsbury Rd
- 1923 Windsor Dr
- 1829 Terrace Dr
- 1705 Foxboro Dr
- 2363 Rockwell Dr
- 2375 Rockwell Dr
- 2387 Rockwell Dr
- 2201 W Club Rd
- 2345 Rockwell Dr
- 2333 Rockwell Dr
- 2360 Rockwell Dr
- 2321 Rockwell Dr
- 2318 Rockwell Dr
- 2346 Rockwell Dr
- 2330 Rockwell Dr
- 2118 Ranchview Ct
- 2113 Ranchview Ct
- 2122 Ranchview Ct
- 2117 Ranchview Ct
- 2109 Ranch View Ct
- 2013 Woodcrest Dr
- 2102 Ranchview Ct
- 2017 Woodcrest Dr
- 2121 Ranchview Ct
- 2009 Woodcrest Dr
- 2105 Ranchview Ct
- 2110 Oak Hollow Rd
- 2118 Oak Hollow Rd
- 2005 Woodcrest Dr
- 2501 Ranchview Rd
- 2101 Ranchview Ct
- 2505 Ranchview Rd
- 2106 Oak Hollow Rd
- 2122 Oak Hollow Rd
- 2001 Woodcrest Dr
Your Personal Tour Guide
Ask me questions while you tour the home.