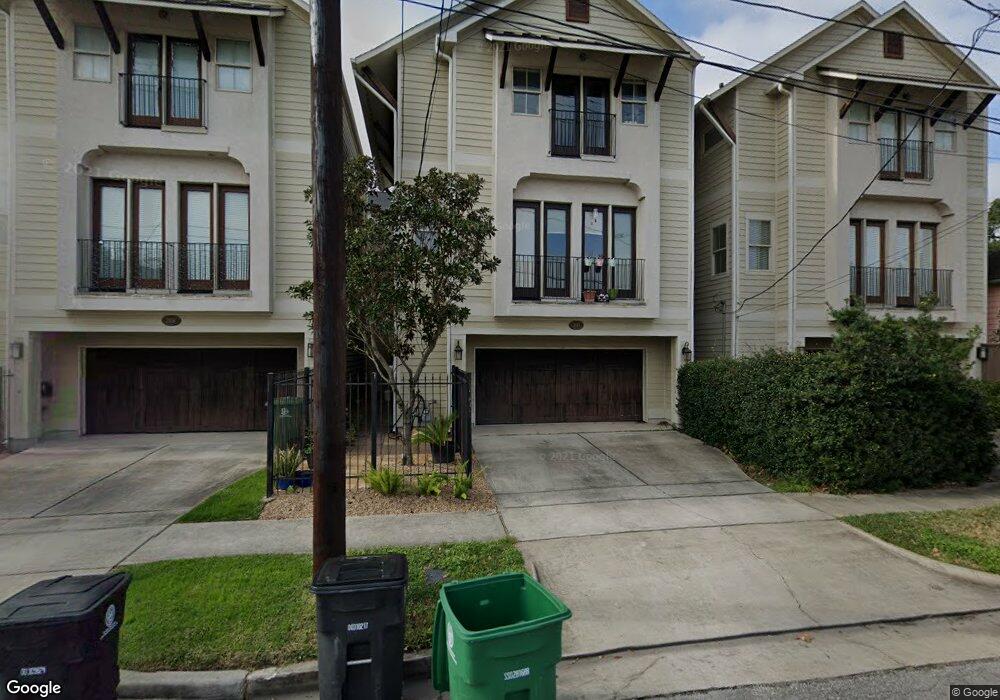
2114 Windsor St Houston, TX 77006
Montrose NeighborhoodEstimated Value: $490,123 - $690,000
3
Beds
4
Baths
2,195
Sq Ft
$274/Sq Ft
Est. Value
About This Home
This home is located at 2114 Windsor St, Houston, TX 77006 and is currently estimated at $601,781, approximately $274 per square foot. 2114 Windsor St is a home located in Harris County with nearby schools including Baker Montessori, Lanier Middle School, and Lamar High School.
Ownership History
Date
Name
Owned For
Owner Type
Purchase Details
Closed on
Dec 16, 2015
Sold by
Damani Shamsha
Bought by
Damani Roshan
Current Estimated Value
Purchase Details
Closed on
Jun 30, 2015
Sold by
Rymal Charles David and Rymal Susan Kay
Bought by
Damani Shamsha
Home Financials for this Owner
Home Financials are based on the most recent Mortgage that was taken out on this home.
Original Mortgage
$344,800
Interest Rate
3.9%
Mortgage Type
New Conventional
Purchase Details
Closed on
Jan 26, 2010
Sold by
Bercon Ltd
Bought by
Rymal Charles David and Rymal Susan Kay
Home Financials for this Owner
Home Financials are based on the most recent Mortgage that was taken out on this home.
Original Mortgage
$181,000
Interest Rate
5.08%
Mortgage Type
New Conventional
Create a Home Valuation Report for This Property
The Home Valuation Report is an in-depth analysis detailing your home's value as well as a comparison with similar homes in the area
Home Values in the Area
Average Home Value in this Area
Purchase History
| Date | Buyer | Sale Price | Title Company |
|---|---|---|---|
| Damani Roshan | -- | None Available | |
| Damani Shamsha | -- | None Available | |
| Rymal Charles David | -- | Startex Title Company |
Source: Public Records
Mortgage History
| Date | Status | Borrower | Loan Amount |
|---|---|---|---|
| Previous Owner | Damani Shamsha | $344,800 | |
| Previous Owner | Rymal Charles David | $181,000 |
Source: Public Records
Tax History Compared to Growth
Tax History
| Year | Tax Paid | Tax Assessment Tax Assessment Total Assessment is a certain percentage of the fair market value that is determined by local assessors to be the total taxable value of land and additions on the property. | Land | Improvement |
|---|---|---|---|---|
| 2025 | $4,875 | $476,494 | $142,500 | $333,994 |
| 2024 | $4,875 | $451,799 | $135,000 | $316,799 |
| 2023 | $4,875 | $437,226 | $135,000 | $302,226 |
| 2022 | $9,627 | $437,226 | $135,000 | $302,226 |
| 2021 | $9,708 | $416,549 | $135,000 | $281,549 |
| 2020 | $9,759 | $403,000 | $135,000 | $268,000 |
| 2019 | $10,660 | $421,289 | $112,500 | $308,789 |
| 2018 | $7,337 | $431,000 | $126,000 | $305,000 |
| 2017 | $11,437 | $431,000 | $126,000 | $305,000 |
| 2016 | $11,437 | $431,000 | $126,000 | $305,000 |
| 2015 | $7,213 | $464,103 | $109,200 | $354,903 |
| 2014 | $7,213 | $397,340 | $84,000 | $313,340 |
Source: Public Records
Map
Nearby Homes
- 1705 Michigan St
- 1728 Michigan St Unit A
- 1728 Michigan St Unit C
- 1718 Welch St Unit C
- 1529 Welch St
- 1709 Haver St
- 1621 Haver St
- 1519 1/2 Welch St
- 1506 Indiana St
- 2025 Park St
- 1524 Welch St
- 2100 Commonwealth St Unit E
- 2100 Commonwealth St Unit G
- 1621 Cherryhurst St
- 1808 Ridgewood St
- Alder Plan at Commonwealth Park Townhomes
- Cypress Plan at Commonwealth Park Townhomes
- Boxwood Plan at Commonwealth Park Townhomes
- 1511 Vermont St Unit A
- 1509 Vermont St Unit D
- 2112 Windsor St
- 2116 Windsor St
- 1702 Michigan St
- 1708 Michigan St
- 1712 Michigan St
- 1710 Michigan St
- 1703 Indiana St
- 1707 Indiana St
- 1701 Michigan St Unit 2
- 1701 Michigan St Unit 4
- 1701 Michigan St Unit 3
- 1701 Michigan St
- 1714 Michigan St
- 1707 Michigan St
- 1711 Indiana St
- 1716 Michigan St
- 1715 Indiana St
- 1703 Michigan St
- 2100 Yupon St
- 1711 Michigan St