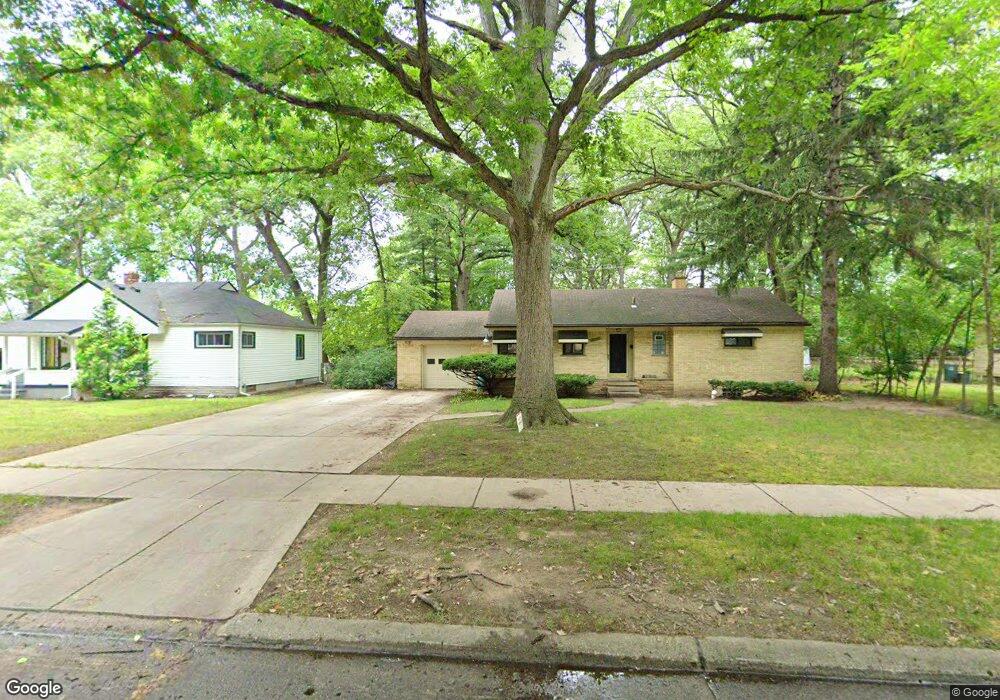
21141 Kipling St Oak Park, MI 48237
Estimated Value: $262,659 - $347,000
3
Beds
2
Baths
1,795
Sq Ft
$169/Sq Ft
Est. Value
About This Home
This home is located at 21141 Kipling St, Oak Park, MI 48237 and is currently estimated at $302,665, approximately $168 per square foot. 21141 Kipling St is a home located in Oakland County with nearby schools including Einstein Elementary School, Oak Park Service Learning Academy, and Oak Park Service Learning Academy Opsla.
Ownership History
Date
Name
Owned For
Owner Type
Purchase Details
Closed on
Nov 9, 2005
Sold by
Morris Eugenia
Bought by
Wedlow Dwayne T
Current Estimated Value
Home Financials for this Owner
Home Financials are based on the most recent Mortgage that was taken out on this home.
Original Mortgage
$162,000
Outstanding Balance
$137,673
Interest Rate
8.75%
Mortgage Type
Adjustable Rate Mortgage/ARM
Estimated Equity
$164,992
Purchase Details
Closed on
Sep 29, 2003
Sold by
Wedlow Dwayne and Wedlow Delores
Bought by
Morris Eugenia
Purchase Details
Closed on
Mar 4, 2003
Sold by
Wedlow Dwayne T and Wadlow Delores
Bought by
Royal Mortgage Inc
Purchase Details
Closed on
May 8, 2001
Sold by
Bank One
Bought by
Wedlow Dwayne T
Purchase Details
Closed on
Feb 24, 1998
Sold by
Wedlow Dwayne T
Bought by
Wedlow Dwayne T
Home Financials for this Owner
Home Financials are based on the most recent Mortgage that was taken out on this home.
Original Mortgage
$78,000
Interest Rate
7.23%
Purchase Details
Closed on
Dec 16, 1997
Sold by
Wedlow Dwayne T
Bought by
First Nationwide Mtg Corp
Create a Home Valuation Report for This Property
The Home Valuation Report is an in-depth analysis detailing your home's value as well as a comparison with similar homes in the area
Home Values in the Area
Average Home Value in this Area
Purchase History
| Date | Buyer | Sale Price | Title Company |
|---|---|---|---|
| Wedlow Dwayne T | $180,000 | Guaranty Title Company | |
| Morris Eugenia | $146,000 | Tri County Title Agency Inc | |
| Wedlow Dwayne | -- | Tri County Title Agency Inc | |
| Royal Mortgage Inc | $124,716 | -- | |
| Wedlow Dwayne T | $88,435 | -- | |
| Wedlow Dwayne T | -- | -- | |
| First Nationwide Mtg Corp | $74,572 | -- |
Source: Public Records
Mortgage History
| Date | Status | Borrower | Loan Amount |
|---|---|---|---|
| Open | Wedlow Dwayne T | $162,000 | |
| Previous Owner | Wedlow Dwayne T | $78,000 |
Source: Public Records
Tax History
| Year | Tax Paid | Tax Assessment Tax Assessment Total Assessment is a certain percentage of the fair market value that is determined by local assessors to be the total taxable value of land and additions on the property. | Land | Improvement |
|---|---|---|---|---|
| 2025 | $2,430 | $153,900 | $29,500 | $124,400 |
| 2024 | $2,343 | $133,600 | $22,300 | $111,300 |
| 2023 | $2,247 | $119,200 | $20,500 | $98,700 |
| 2022 | $2,163 | $97,800 | $16,500 | $81,300 |
| 2021 | $2,154 | $90,500 | $9,700 | $80,800 |
| 2020 | $2,088 | $74,200 | $9,700 | $64,500 |
| 2018 | $2,100 | $47,000 | $0 | $0 |
| 2015 | -- | $36,500 | $0 | $0 |
| 2014 | -- | $32,400 | $0 | $0 |
| 2011 | -- | $42,900 | $0 | $0 |
Source: Public Records
Map
Nearby Homes
- 21160 Kipling St
- 20760 Ridgedale St
- 21400 Parklawn St
- 14220 Greenbriar St
- 20529 Ardmore St
- 20496 Mark Twain St
- 20522 Tracey St
- 20475 Tracey St
- 20423 Freeland St
- 14211 Northend Ave
- 20426 Tracey St
- 21701 Parklawn St
- 21661 Cloverlawn St
- 20190 Stansbury St
- 21611 Sussex St
- 20164 Tracey St
- 20120 Mark Twain St
- 21741 Church St
- 20196 Hartwell St
- 20150 Schaefer Hwy
- 21161 Kipling St
- 21131 Kipling St
- 21171 Kipling St
- 21111 Kipling St
- 21191 Kipling St
- 21140 Kipling St
- 13991 Greenbriar St
- 20800 Parklawn St
- 21130 Kipling St
- 21170 Kipling St
- 14001 Greenbriar St
- 21000 Kipling St
- 20841 Kipling St
- 21201 Kipling St
- 14011 Greenbriar St
- 21190 Kipling St
- 20808 Parklawn St
- 21141 Westhampton St
- 21161 Westhampton St
- 21221 Kipling St
Your Personal Tour Guide
Ask me questions while you tour the home.