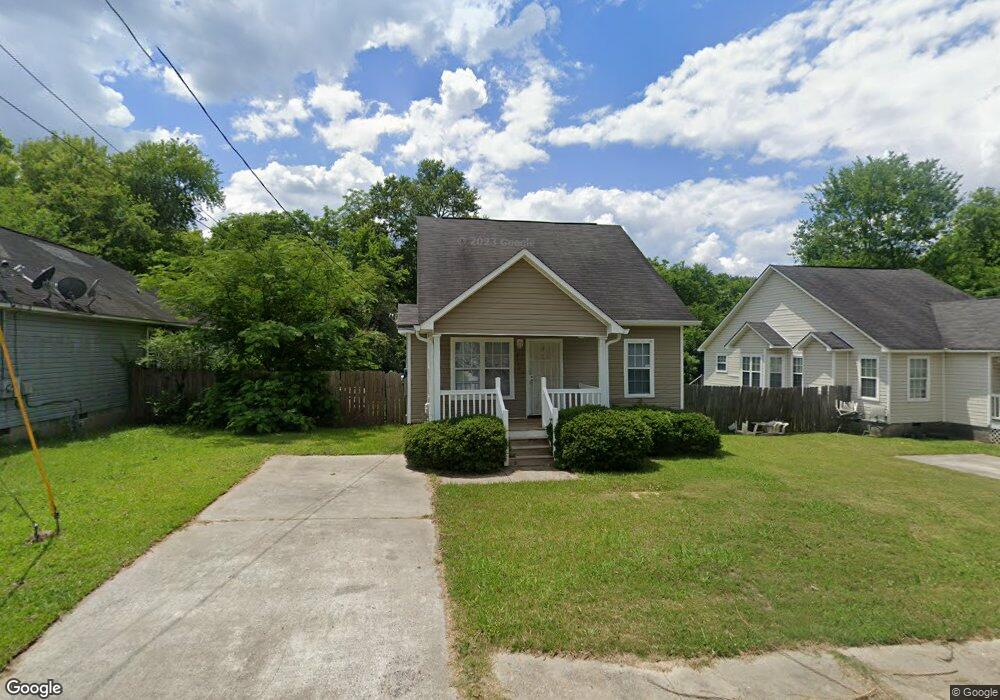
2115 Cedar Ave Macon, GA 31204
Estimated Value: $97,000 - $175,000
3
Beds
2
Baths
1,150
Sq Ft
$108/Sq Ft
Est. Value
About This Home
This home is located at 2115 Cedar Ave, Macon, GA 31204 and is currently estimated at $123,770, approximately $107 per square foot. 2115 Cedar Ave is a home located in Bibb County with nearby schools including Hartley Elementary School, Southwest High School, and Cirrus Charter Academy.
Ownership History
Date
Name
Owned For
Owner Type
Purchase Details
Closed on
Jul 12, 2012
Sold by
Macon Bibb County Economic Opportunity C
Bought by
Drawde Llc
Current Estimated Value
Purchase Details
Closed on
Jan 2, 2008
Sold by
Mobley Tiffany L
Bought by
Macon Bibb County Eoc
Purchase Details
Closed on
Jan 3, 2006
Sold by
Mobley Tiffany L
Bought by
Eoc
Home Financials for this Owner
Home Financials are based on the most recent Mortgage that was taken out on this home.
Original Mortgage
$63,600
Interest Rate
6.22%
Mortgage Type
New Conventional
Purchase Details
Closed on
Apr 5, 2005
Purchase Details
Closed on
Aug 12, 2004
Create a Home Valuation Report for This Property
The Home Valuation Report is an in-depth analysis detailing your home's value as well as a comparison with similar homes in the area
Purchase History
| Date | Buyer | Sale Price | Title Company |
|---|---|---|---|
| Drawde Llc | $5,900 | None Available | |
| Macon Bibb County Eoc | $63,600 | -- | |
| Macon Bibb County Economic Opportunity C | $59,378 | None Available | |
| Eoc | $48,000 | Na | |
| Mobley Tiffany L | $79,500 | Na | |
| -- | $62,100 | -- | |
| -- | $73,000 | -- |
Source: Public Records
Mortgage History
| Date | Status | Borrower | Loan Amount |
|---|---|---|---|
| Previous Owner | Mobley Tiffany L | $63,600 |
Source: Public Records
Tax History
| Year | Tax Paid | Tax Assessment Tax Assessment Total Assessment is a certain percentage of the fair market value that is determined by local assessors to be the total taxable value of land and additions on the property. | Land | Improvement |
|---|---|---|---|---|
| 2025 | $1,070 | $43,562 | $3,082 | $40,480 |
| 2024 | $1,089 | $42,887 | $3,082 | $39,805 |
| 2023 | $911 | $35,858 | $2,125 | $33,733 |
| 2022 | $980 | $28,306 | $1,244 | $27,062 |
| 2021 | $875 | $23,036 | $1,244 | $21,792 |
| 2020 | $894 | $23,036 | $1,244 | $21,792 |
| 2019 | $902 | $23,036 | $1,244 | $21,792 |
| 2018 | $1,561 | $23,036 | $1,244 | $21,792 |
| 2017 | $863 | $23,036 | $1,244 | $21,792 |
| 2016 | $797 | $23,036 | $1,244 | $21,792 |
| 2015 | $1,128 | $23,036 | $1,244 | $21,792 |
| 2014 | $1,808 | $32,093 | $3,606 | $28,487 |
Source: Public Records
Map
Nearby Homes
- 2125 Cedar Ave
- 210 Moseley Ave
- 670 Poppy Ave
- 1323 Crawford St
- 2106 Mason St
- 1545 Anthony Rd
- 576 Pansy Ave
- 660 Lilly Ave
- 2164 Monroe Ave
- 1144 Carroll St
- 1121 Carroll St
- 2149 & 2147 Mercer University Dr
- 742 Grayson Ave
- 730 Grayson Ave
- 284 Grosso Ave
- 458 Daffodil St
- 460 Daffodil St
- 2420 Adams Ave
- 815 Edwards Ave
- 2445 Adams Ave
Your Personal Tour Guide
Ask me questions while you tour the home.